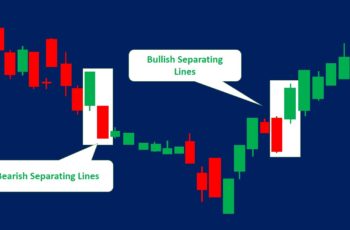
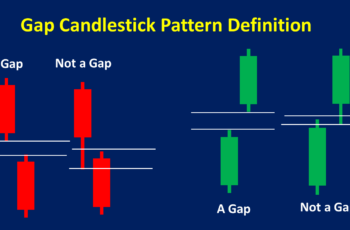
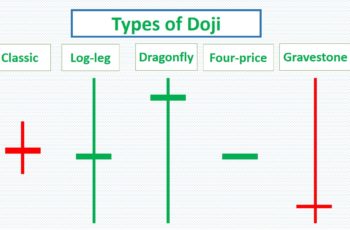
Candlestick patterns are charting techniques in which one candle or multiple candles make a structure that suggests the future direction.
Candlestick charting is one of the most popular ways technical traders use it.
But what is a candlestick?
Let me briefly explain the candlestick itself first.
What Is a Candlestick?
A candlestick is a graphic that displays four important prices in a session (opening, closing, highest and lowest prices) in charts, such as hourly, daily, weekly, etc.
We call it a candlestick because it resembles candles.
Candlestick charts are similar to bar charts, showing the same prices. However, candles are more beautiful and easier to use. Moreover, candles make candlestick patterns that help us predict future prices.
In the financial market, a candlestick is the same as a candle. You may read or hear both, but they are the same thing.
A candle is either bullish (generally colored green) or bearish (colored red). A Bullish candle is a candle whose closing price is higher than the opening price. A Bearish Candle represents a candle whose opening price is higher than its closing price.
Four important prices that I mention early are the followings:
- Opening price: The opening price represents the price of the first second of that particular period. In a bullish candle (mostly decorated green), the opening price is the bottom of the main body. In a bearish candle (mostly decorated red), the opening price of that period is the top of the main body.
- Closing price: The closing price represents the price of the last second of that particular period. In a green candlestick, the closing price is the upper point of the candle’s body. In a red candle, the closing price is the lower point of the candle’s body.
- Highest price: In bullish and bearish candles, the highest point of the upper tail or shadow represents the highest price of an instrument during a period.
- Lowest price: In bullish and bearish candles, the lowest point of the lower tail or shadow represents the lowest price of an asset price in a session.
What Are Candlestick Patterns?
As mentioned earlier, candlestick patterns are one or multiple candles that make a structure, suggesting future movements.
This technique was developed in the 18th century by a Japanese trader, Munehisa Homma. He was a rice trader and used candles for charting to trade rice futures.
A single candlestick pattern represents price changes in a specific period (time frame), such as hourly, weekly, 5-minute, and 10-minute charts. An example of a single candlestick pattern is the hammer, which suggests a reversal from a downtrend to an uptrend.
Engulfing pattern is an example of multiple candlestick patterns that contains two candles. Engulfing pattern occurs at the bottom of a trend and suggests the reversal of a trend.
Candlestick patterns are more useful for large time-frames such as daily, weekly and monthly charts. They are helpful in short time frames but not as much as in larger time frames.
Types of Candlestick Patterns
Generally, candlestick patterns are divided into reversal and continuation patterns.
However, most of them are reversal patterns.
Reversal Candlestick Patterns
Reversal candlestick patterns are single or more candles that form at the top or bottom and suggest a possible new direction.
There are two types of reversal patterns: bullish and bearish.
Bullish Candlestick Patterns
Bullish candlestick patterns appear at the bottom of a trend or the end of bullish continuation patterns, such as flags and triangles. These patterns suggest a possible future uptrend.
Some of these patterns are the followings:
- Bullish engulfing pattern
- Bullish harami
- Hammer and inverted hammer
- Piercing Pattern
- Spinning Top
- Frypan bottom
- Three white soldiers
- Morning star
- Bullish counterattack lines
- Bullish tweezers
- Belt-hold lines
Bearish Candlestick Patterns
Bearish candlestick patterns appear at the top of a trend or the end of a bearish continuation pattern. These patterns suggest a possible future downtrend.
Some of the bearish candlestick patterns that we have written about are the followings:
- Bearish engulfing pattern
- Bearish Harami
- Shooting star
- Dark cloud cover
- Hanging man
- Spinning top
- Dumpling Top
- Tri-star
- Three black crows
- Evening star
- Upside-gap two crows
- Bearish counterattack lines
- Bearish tweezers
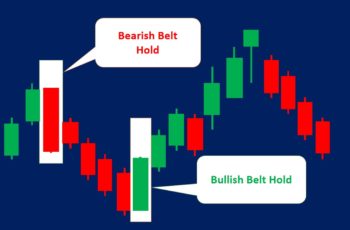
- Bearish Belt hold lines
Continuation Candlestick Patterns
Continuation candlestick patterns occur in a trend and suggest that the direction will continue.
Some of them that we have covered are the followings:
How to Use Candlestick Patterns?
Because a single candle or a few candles make a pattern, it signals earlier than other chart patterns such as wedges.
And the risk of being wrong is also high.
Things that you read here, apply them every time that you discover a candlestick pattern. However, it is not complete, and every pattern has its features.
General guidelines to remember when you find a candlestick pattern are the followings:
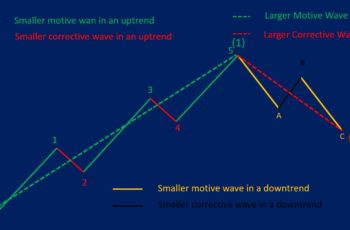
- To reduce your risk, you must combine them with other technical techniques such as patterns, Elliott Wave Theory, technical indicators, and so on. In addition, do not forget to check the economic calendar, news, and fundamental data.
- One of the best ways to confirm if your analysis is right or wrong, look at candles before the current pattern. For example, if a bullish engulfing pattern follows a shooting star or a hanging man, the chance of reversal is much higher than only the engulfing pattern. Moreover, use a leading indicator such as momentum and MACD for overbought and oversold signals. These indicators help you a lot early by converging or diverging.
- Top of a bearish reversal or bearish continuation pattern acts as a resistance line. When you sell, put your stop-loss a little bit higher than the resistance line.
- The bottom of the bullish reversal or bullish continuation pattern acts as a support line. When you buy, put your stop-loss under the support line.
- Candlestick patterns do not specify the take-profit level. So, when a reversal pattern appears, and other techniques confirm it, it is the place to close your current position.
Bottom Line
Candlestick is one the most popular way to display prices on the chart along line charts and bar charts. A candle shows the high, low, opening, and closing prices of a session and creates patterns that help traders predict future movements.
There are two types of candlestick patterns: reversal and continuation. However, most of them are reversal structures.

