What is Elliot Wave Theory?
Elliott Wave Theory (EWT) developed by Ralph Nelson, is a technical analysis approach also famous as Elliot Wave Principle (EWP). He believed that everything moves in waves, including price charts. And he developed his theory in 1930.
Ralph Nelson developed this theory by studying Dow Jones Index (DJI). Probably it is not incorrect to say that Elliott Wave Theory (EWT) is an evolved version of Dow Theory due to having too many similarities.
Since his death, the EWP has evolved. Since then, many professionals have furnished this theory, making it one of the most famous techniques.
I don’t think we need to memorize the names of these developers or study their biographies. So, I am not going to explain who they are.
Mr. Elliott claimed that the market price is moving like waves. And these waves are structures, also known as chart patterns, and the timeframes of these waves are different (will be explained).
Generally, he believed that there are two types of waves, and they are:
- Waves that go with direction known as an impulse, spike, and jump moves; and
- Waves that counter the main direction, known as corrections, consolidations, and reactionary moves. And correction waves appear as continuation patterns.
If the price of a financial asset moves upward or downward in waves, the main wave (the larger wave) that moves with direction should have at least five smaller waves. And the wave (larger degree wave) that moves against the direction should have at least three smaller waves.
Every single wave has much smaller waves in it. For example, a wave that appears in the daily chart has many smaller waves in the hourly chart, 5-minute chart, etc. The principle is the same for all of the timeframes.
Now I am going to explain them one by one in simple words.
The Five Wave Pattern
A price movement starts with a five-wave pattern. This five-wave pattern consists of three waves that move with direction and two waves that counter or consolidate.
In a motive wave (spike), waves are labeled by numbers (1, 2, 3, 4, and 5)
In bullish trends waves 1, 3, and 5 are moving in the main direction. On the other hand waves 2, and 4 go against the direction, or we can say that they correct market price.
A five-wave pattern is in reality just one wave of a larger timeframe. For example, a five-wave pattern in the hourly chart can be just one motive wave in the daily chart. (You read about wave degrees later)
And every wave of a five-wave pattern is made of many smaller waves in shorter timeframes (degree). For example, wave 2 is made of a three-wave pattern (A, B, and C waves).
The Three-Wave Pattern
The three-wave pattern develops against the main direction acting as an interruption. Analysts label them with letters. (A, B, and C).
Every Three Wave Pattern is a single correction wave in a larger timeframe. And multiple smaller spikes and correctives exist inside an interruption wave of a larger degree. (You read about wave degrees later)
For example, the three-wave pattern in the daily chart is just one corrective wave in the weekly chart, and many waves in the hourly chart, 4-hour charts, 15-minute charts, etc.
Wave Degrees (Naming Waves)
Elliot introduced nine degrees of waves starting from the yearly chart and ending with minutes.
He suggested using numbers for motive waves and letters for corrective waves.
You can name as you wish. Name what you like. To understand easier and not confuse, it is better to label a degree always the same.
Forces Behind Wave Formation
We know that prices in the financial market move in waves.
What are those things that the Elliott wave theory relies on?
Numerous determinants affect a financial asset price, such as financial reports, news, a rumor, and even a tweet by a public figure.
A price determinant creates hope and fear, which spreads among investors and traders, moving the price up or down.
All factors that affect the market price of financial assets have a role in wave formation.
Some of the determinants have huge impacts, which is the reason behind big waves, while others may have tiny influences causing smaller wave formation.
An investor will never know every determinant that influences the market price. That is why we need to learn technical analysis. If someone understands every price determinant, he will make billions out of millions in months.
Features of Motive Wave in Elliott Wave Theory
Each wave reflects the psychology of the crowd as the wave develops.
As mentioned earlier, analysts label them by numbers.
Although we don’t know all factors, behavioral theories explain the formation of waves. So, it will be helpful to consider these features as waves develop.
Each of the five-wave which is a single wave to a larger degree, I will elaborate one by one. I am going to start from the bullish first wave of the five-wave.
Features of Wave 1
Wave (1) begins during a period of disbelief.
At the beginning of wave (1), the news is mainly bad, fundamentally does not look good, and economic indicators do not show satisfactory movements.
Because wave (1) starts during a downside, some investors believe that wave (1) is a correction pattern to the downside. So, volume increases subtly (not hugely) and moves upward slightly slower.
Features of Wave 2
Because wave (1) starts during disbelief, wave (2) retraces (pullback) substantially but fails to extend beyond the beginning of wave (1).
During wave (2), news and fundamentals are still unpleasant. Generally, wave (2) takes a long time to end, accompanied by low volume and volatility.
Features of Wave 3
In general, wave (3) is more powerful and broader than wave (1) and wave (5).
During the wave (3) development, volume is high, gaps in the stock market occur frequently, fundamentals are getting convincing, and investors’ confidence is boosted.
Corrections that form during wave (3) are minor and short-lived.
Features of Wave 4
In wave 4, probably the most growth has ended. Generally, wave 4 has a low slope or goes sideways as the confidence created in wave (3) is still there.
Some stocks start declining as investors see them overvalued.
Features of Wave 5
In wave (5), the news is still positive, and investors are confident. Volume in this phase is lower than wave (3).
Generally, not always, wave (5) has a smaller slope compared to wave (3) because some investors take profit and unpleasant news slowly emerges.
Features of Three Waves in the Elliott Wave Theory
Three waves are commonly named alphabetically (A), (B), and (C). Wave (A) and (C) are impulses to the opposite of the main trend, and wave (B) is corrective.
The three-wave structure has some features and this article explains them.
Features of Wave (A)
Generally, during wave (A), investors believe that this reaction is just a pullback to the main trend. So, the slope of the trend is relatively low. And some investors still buy.
Wave (A) may have five-wave structures or three-wave structures. If it had five wave structure, it is more likely that the pattern is a zigzag (traditionally known as ABCD pattern). On the other hand, if it was a three-wave structure, one of the triangle patterns is more likely.
Features of Wave (B)
Wave (B) is a bull trap accompanied by emotions.
Some stocks in the stock market perform well, and some don’t. There is not enough momentum, and market breadth (the difference between winner stocks and loser stocks) is narrow.
Generally, wave (B) is confirmed by other technical and economic indicators showing a bull market.
Features of Wave (C)
Wave (C) has similarities with the five waves’ third wave, making one larger motive wave.
Wave (C) mainly moves faster. Investors mostly believe that this wave is moving in the main direction. Volume and volatility are high.
Motive Wave (Five-Wave) Patterns
Five smaller waves make a large wave that moves with the trend.
They are named numerically.
Wave (1), (3), and (5) are impulses that help to develop one higher time frame degree.
So, there are some conditions to be recognized as a motive wave. If one of these conditions does not meet, the wave will be a corrective wave.
A market can be an upside or downside. To illustrate, I explain those conditions in a bullish market. After reading the following conditions, you understand them in a bear market too.
Here are five conditions:
- Wave (2) does not fall below the start of wave (1);
- Wave (4) does not go below the start of wave (3);
- Wave (3) always goes beyond the end of wave (1);
- Wave (3) is never the shortest; and
- Waves (2) and (4) must have a corrective pattern.
I mention once again that if one of the above conditions does not meet, it is not a motive wave, even if it has five waves.
Generally, there are two types of motive waves, impulses and diagonals.
Impulses in the Elliott Wave Theory
Impulses are a five-wave structure that sticks to the main conditions of a motive wave plus the following three conditions.
- The end of wave (1) and the end of wave (4) doesn’t reach the same price;
- Wave (1), (3), and (5) have motive structures; and
- Extensions cannot occur in all waves (1), (3), and (5) at the same time.
Generally, impulses are extensions and truncations.
I will discuss both of them in the following.
1. Extension Waves
An extension is a stretch that occurs during one of the waves (1), (3), and (5).
And extensions are very common to happen, which itself has 5 smaller waves.
2. Truncation Waves
Truncation is a feature of an impulse wave in which its 5th does not reach beyond the end of wave (3), although it has five waves. So, it only occurs in wave (5). Truncation is a sign of a sharp opposite trend.
Diagonals in the Elliott Wave Theory
Diagonals are motive waves that occur either in wave (1) or wave (5) of an impulse wave.
But they never form in the third wave.
These waves adhere to impulse wave conditions. However, in diagonals, the end of wave (4) may overlap the end of wave (1).
Diagonals can rise or fall. In addition, the diverging and converging diagonals are common.
Diagonals are different from triangles as diagonals are motive in pattern and triangles are corrective patterns. In addition, in diagonals, both support and resistance trendlines go upward or downward, while in a triangle, at least one of them goes sideways.
Namely, there are two types of diagonals, called leading and ending diagonals.
In traditional technical analysis, diagonals are similar to wedge patterns: Wedge Pattern: Rising & Falling Wedges, Plus Examples
1. Leading Diagonals
The leading diagonal develops as a motive wave at the beginning of a new trend. It can appear as wave (1) of the five-wave motive wave in structure or as wave A of a corrective pattern.
A leading diagonal can be converging or diverging. Converging means that the structure gets narrower as the pattern develops. It is like a wedge pattern.
Diverging means that the structure becomes broader as the pattern develops. It is like an expanding wedge.
2. Ending Diagonals
As the name implies, the ending diagonal happens as wave 5th of five waves in the motive structure or wave (C) of the corrective structure.
Ending diagonals also can converge or diverge as the wave develops.
The following image shows converging ending diagonals.
And diverging ending diagonals look like the following.
Corrective Waves Structures in the Elliot Wave Theory
Corrective waves are responsible for interruptions that force the main direction to consolidate.
Any formation that does not abide by motive wave rules automatically goes to the corrective family.
Primarily corrective waves are sharp and sideways.
A sharp movement pattern makes a zigzag shape, while sideways are manifested through Flats and Triangles.
Zigzags
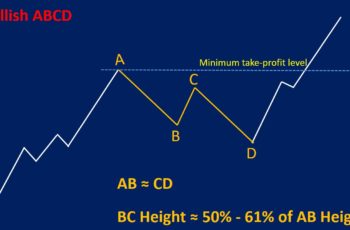
Zigzags are the most common corrective pattern in Elliott Wave Theory. They appear as a three-wave pattern and are labeled in letters (A), (B), and (C). Traditionally, a zigzag is known as an ABCD pattern.
In a zigzag pattern, wave (B) will never pass beyond the start of wave (A), and wave (C) will go beyond the end of wave (A).
In a zigzag, wave (A) is a five-wave (also known as an impulse) pattern of motive in a structure that can either be an impulse or a leading diagonal pattern. Wave (B) functions as a corrective to the new direction, made of three waves. And lastly, wave (C) is again a motive wave of a five-wave pattern that can be an impulse or an ending diagonal. A zigzag is also known as a 5-3-5s pattern.
Flat Corrective Waves in the Elliott Wave Theory
Flats are corrective patterns that go sideways. They are three wave patterns and are named alphabetically (A), (B), and (C). Wave (A) and (B) are three-wave patterns, and wave (C) is a five-wave pattern. Flats are also known as a 3-3-5s wave pattern.
Unlike zigzags, in a flat structure, wave (A) cannot form a five-wave pattern. It is the three-wave pattern. Flats also do not retrace as much as zigzags do.
Mainly there are three types of flats, regular, expanded and running flats.
1. Regular Flats
A regular flat structure looks like a flat. It means that the support and resistance lines of the pattern are parallel to each other.
Traditionally, this pattern is known as a rectangle, and here is an article that explains in detail: Rectangle Pattern: Types, Trading Strategy, Features & Examples
In a regular flat, wave (B) ends at the starting point or near the starting point of wave (A). Wave (C) ends at the starting price of wave (B) or near the starting price of wave (B).
2. Expanded Flats
In an expanded flat, the distance between the support and resistance lines of the pattern gets wider from the left to the right side of a pattern. It means that wave (B) finishes beyond the start of wave (A), and wave (C) finishes beyond the start of wave (B).
3. Running Flats
In a running Flat, wave (B) passes the beginning of wave (A) but, wave (C) fails to pass the start of wave (B).
Or, we can say that the support and resistance lines of the pattern in a bull market go upside and downside in a bear market.
Formation of a running flat is rare than expanded and regular flats. It happens when the main trend is stronger than the counter-trend.
Triangles in the Elliott Wave Theory
Triangles are corrective patterns made of a five-wave structure. And each wave has three waves.
In other words, it is a correction pattern made of 3, 3, 3, 3, 3 smaller waves.
Because it is a corrective pattern, analysts label waves alphabetically: A, B, C, D, and E.
Commonly triangles are three types, contracting, expanding, and running triangles.
Here is an article explaining triangles in traditional way: Triangle Pattern: Types, Trading Guide & Examples
1. Contracting Symmetrical Triangles
In contracting triangles, the distance between the support and resistance lines of the pattern becomes closer as the structure develops.
Or in other words: Wave (C) does not go beyond the end of wave (A), wave (D) does not go beyond the end of wave (B), and wave (E) does go beyond the end of wave (C).
2. Expanding Symmetrical Triangles
In an expanding triangle, the distance between the support and resistance lines of the pattern gets wider as the pattern develops.
Or in simple terms: wave (C) goes beyond the end of wave (A), wave (D) goes beyond the end of wave (B), and wave (E) goes beyond the end of wave (C).
3. Ascending Triangle
An ascending triangle is a correction wave in which the upper line (end of wave B connected to wave D) is flat, and the lower line (end of wave A, C, and E connected line) ascends.
This wave is more common in an uptrend. However, it might also appear in a downtrend.
4. Descending Triangle
A descending triangle is a corrective wave in which its upper line descends while the lower line is flat.
In other words, the line that connects the end of waves A, C, and E is flat, and the line that connects the end of waves B and D is rising.
A descending triangle appears more often in a downtrend than an uptrend.
5. Running Triangles
Running triangles in Elliott Wave Theory is a type of triangle in which wave B moves beyond the start of wave (A).
Theses waves are mainly three types, symmetrical, descending, and ascending running triangles.
In a running symmetrical triangle, the support line of the pattern moves upward in a slope, while the resistance line of the pattern moves downward in a slope.
However, in a running descending triangle, the support line of the pattern moves sideways, and the resistance line of the pattern moves downward in a slope.
In a running ascending triangle, the support line of the pattern moves upward in a slope while the resistance line of the pattern moves sideways.
Elliott Wave Theory Cheat Sheet
Here are all of the patterns in the Elliott Wave Theory.
Does the Elliott Wave Theory Work?
It is difficult to say if the Elliott wave theory works or not. For some, it works, and for some, it does not.
If it works, it should fulfill your expectations. Your expectations could be a 60% winning rate, which means this theory works for you if tested and won 6 trades out of 10 or 60 out of 100. And if it fails to work, the winning rate could be much lower, for example below 60%.
Those investors who do not think this theory works believe that the Elliott wave theory explains other traditional chart patterns in a more complicated way.
On the other hand, supporters of this theory believe it does work because of the natural law, in which everything moves in waves, including the heartbeat.
You should not forget that the Elliott wave is a theory. And a theory is different from practical applications.
I tested and experienced many years. What I found is that the Elliott wave theory works but not alone. And combine it with other methods, such as using technical indicators and candlestick patterns. From technical analysis points, every technique is a confirmation of other techniques. So, learn and practice every method.
Moreover, I believe that every technique is developed because it works at least in a market. For example, candlesticks work better in the stock market, and a technical indicator such as Relative Strength Index works better in the binary options market.

