Ad Blocker Detected
Our website is made possible by displaying online advertisements to our visitors. Please consider supporting us by disabling your ad blocker.
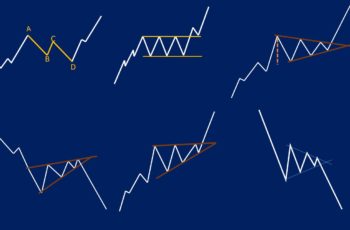
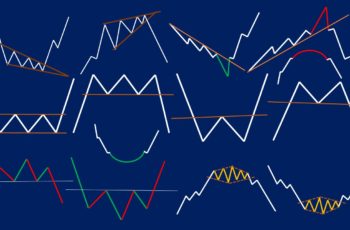
Chart patterns are the main part of technical analysis, and they are structures that occur on the chart and suggest possible future movements.

![Diamond Chart Pattern Explained [Example Included] Diamond Chart Pattern Explained [Example Included]](https://srading.com/wp-content/uploads/2022/12/diamond-chart-pattern-top-350x230.jpg)
Our website is made possible by displaying online advertisements to our visitors. Please consider supporting us by disabling your ad blocker.
| Cookie | Duration | Description |
|---|---|---|
| cookielawinfo-checkbox-analytics | 11 months | This cookie is set by GDPR Cookie Consent plugin. The cookie is used to store the user consent for the cookies in the category "Analytics". |
| cookielawinfo-checkbox-functional | 11 months | The cookie is set by GDPR cookie consent to record the user consent for the cookies in the category "Functional". |
| cookielawinfo-checkbox-necessary | 11 months | This cookie is set by GDPR Cookie Consent plugin. The cookies is used to store the user consent for the cookies in the category "Necessary". |
| cookielawinfo-checkbox-others | 11 months | This cookie is set by GDPR Cookie Consent plugin. The cookie is used to store the user consent for the cookies in the category "Other. |
| cookielawinfo-checkbox-performance | 11 months | This cookie is set by GDPR Cookie Consent plugin. The cookie is used to store the user consent for the cookies in the category "Performance". |
| viewed_cookie_policy | 11 months | The cookie is set by the GDPR Cookie Consent plugin and is used to store whether or not user has consented to the use of cookies. It does not store any personal data. |
