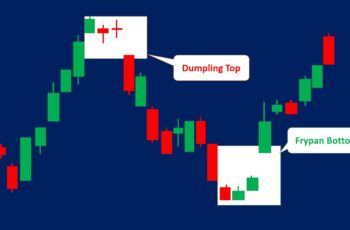
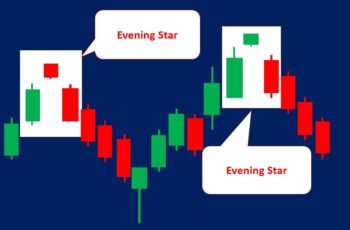
The candlestick chart is the most popular technique to show price changes in the financial market.
This technique was produced in Japan and imported by other countries.
Before the candlestick chart, western investors used bar and line charts.
Now, bar and line charts are almost forgotten because they are as efficient as candles in finding patterns.
Candle charts make shapes that have meaning. And these meanings apply to any time frame.
Investors and traders can use candlestick charts in any financial market, such as forex, crypto, future, stock, etc.
Here is to 8 reasons that may convince you.
1. Candlestick Chart Patterns Signal Earlier
Because its patterns constitute one candle or multiple, it signals much faster than classical technical analysis such as Moving Average (MA) and chart patterns such as triangles.
Early signals inform us to close our open positions or initiate a new one, and both cases are beneficial.
Here is an example from S&P 500.
In the above chart, for the candlestick chart analysts, the hammer has enough confirmation to signal an uptrend.
Here are those signals: (1) Before the hammer a long-legged candle, almost a long-legged doji, warned about a reversal. (2) Sessions earlier, three candles made a support line. All of them tried to break it but failed. It is a clear indication of a support line. (3) A zig-zag pattern was completed.
An aggressive candlestick trader will go long after the completion of the hammer, and his stop-loss would be at the bottom of the hammer. The non-aggressive trader will wait for another candle to confirm it. In this case, he will go long at the second line, and his stop-loss would be again under the hammer.
However,
Non-candlestick traders will wait to break the resistance line, and another candle validate it. The stop-loss of these traders also will be the bottom of the hammer.
As you see, the hammer signaled much earlier than the resistance line leading to more profits. These are why traders should learn candlestick chart patterns.
2. Low risk
In candlestick charting techniques, the bottom of the top of the pattern acts as a support or resistance line. Compared to other charting techniques, such as classical chart patterns, the risk is much lower because you have to wait until the price breaks the support or resistance line.
But, in candlestick patterns, you do not have to wait.
Thus, using a candlestick chart, you can profit more by closing earlier and entering earlier.
For example, if you use the MA line as a signal provider, you must wait until the price cross the MA line. In this case, trading signals will trigger late, and the stop loss will be far away.
(look at above example)
Based on the above S&P 500 chart, an aggressive candlestick trader will risk from the bottom of the hammer up to the first red line, and a non-aggressive candle analyst will risk from the bottom of the hammer, up to the second red line.
However, the non-candlestick trader will risk from the bottom of the hammer to the third line (blue line).
In any case, the non-candlestick analyst will risk more.
3. Reading Candlestick Chart Is Easy
Every candle or combination of candles has something to say.
For example, a doji means indecision. If it appears at the end of an extended trend, it implies that the current trend has lost strength. And market participants are in an indecision moment. Thus, a counterattack is enough to change the direction.
Another example is the hammer pattern, which looks like a hammer, and its shape express rejection of the downtrend.
4. Candlestick Chart Patterns Are Reliable
Candlestick chart patterns are reliable if used properly. I mean that traders should look at broader pictures to make a decision on what a candlestick pattern says.
For example, supporting signals should confirm a pattern. And if there is no confirmation, it is better to avoid trading.
Here is a chart expressing why the broader picture is important.
In early November, a green shooting star appeared. It is a bearish reversal pattern.
However, there was only one weak supporting signal, a possible resistance line.
Other signals that contradict the shooting star are:
- The shooting star itself closed higher than the opening price, which indicates to be cautious about the shooting star prediction.
- The predecessor candle is a hammer that succeeded a long green candle. It is a bullish signal.
- In the broader picture, a zig-zag correction pattern was completed in late October. It is a possible bullish signal, or at least a caution signal.
- One of the best technical analysis principles is to wait when you are not sure. In the above chart, the next candle did not close below the shooting star.
The candlestick chart patterns are reliable if combined and looked for surroundings. However, every trader should remember that chart analysis is subjective and does not always produce the same result.
A short disclaimer: nothing in the financial market and on this website is guaranteed. Read our disclaimer statement here.
5. Learning Candlestick Charting Is Easy
Learning candlestick chart techniques is easy due to the body and shadows of candles. Any size of tails and candles transfers a meaning.
For example, a long body without shadows indicates that drivers are potent, and 4-price doji means that bulls and bears are equal in power.
6. Candles Can Help Other Techniques
You can use candles with every other tool and technique. It is complementary to technical indicators and confirms their signals.
7. Studying Charts Become Easier
Learning history is easy with candlesticks. For example, if you want to study the GDP impacts on a specific financial asset, you can find all of them and conclude.
8. Candlestick Charting Is the Best Option For Day traders
Day traders open and close their position on the same day. So, they need technical analysis that triggers signals quicker to initiate a new one or close their current position.
Candlestick patterns signals faster than any other.
The disadvantage of Candlestick Chart Patterns
Everything has good and bad sides.
Candlestick chart is no exception.
Probably the biggest disadvantage of candlestick chart patterns is that they do not define take-profit level.
However, you offset it by using other tools such as Fibonacci retracement. As mentioned earlier, you can combine candles with other techniques to validate your analysis.
Final Words
Candlestick chart analysis is a great method for the examination of financial assets.
The best way to use it is to combine it with other tools and experiences.

