Recognizing reversal candlestick patterns is vital to the technical analyst in the stock market. They signal earlier and are rewarding tools for a stock chart examination.
And most of the candlestick patterns are reversals in nature compared to continuation candlestick patterns.
Candlestick patterns analysis work in any financial asset chart such as forex and cryptocurrency market. However, it is an essential and a must-learning technique for stock trading.
Candlestick chart analysis works better in the stock than in any other market because of opening and closing price gaps. Most candlestick patterns have a gap between the opening and closing prices of two or multiple candles, which are common in the stock and not the forex or crypto market.
And single-candlestick formations, such as a hammer and a shooting star have the same meaning in any market. It does not matter if you trade stock, forex, crypto, CFDs, or anything else.
Candlestick charting techniques work in any chart, but the trader should understand that gaps are not common in every asset chart. Moreover, there are many single candlestick formations having only one candle.
This article explains the top reversal candlestick patterns that regularly appear and are reliable. We have a separate article for each of them. So this article does not cover everything about it.
Engulfing Patterns
Engulfing patterns are among the most reliable reversal candlestick formations. The good thing is that they form frequently.
There are bullish and bearish engulfing patterns. A bullish engulfing pattern occurs at the bottom of a trend and a bearish one at the top.
In a bullish engulfing, a small red candle closes at the end of a downtrend, followed by a large green candle that engulfs (envelopes) the first candle. And in a bearish engulfing, a tiny green candle closes at the top of an uptrend, followed by a large red candle.
Related article: Engulfing Candlestick Patterns (Types, Examples & How to Trade)
Harami Patterns
A harami reversal candlestick pattern containing two candles.
There are two types of harami patterns: bullish and bearish.
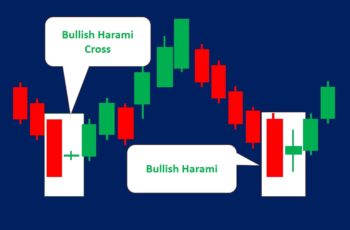
A bullish harami candlestick pattern starts at the bottom of a downtrend. The first candle is a large green candle, and the second is smaller enveloped by the first one. It completes after the closing price of the second candle inside the first candle’s price range. And investors expect an uptrend after a bullish harami pattern. If the second candle is a doji, it is called a harami cross.
A bearish harami reversal candlestick pattern begins at the top of an uptrend. The first candle is large and green, and the second is smaller enveloped by the first candle. After the completion of the pattern, investors expect a downtrend.
Related articles:
- Bullish Harami Pattern (How to Trade & Examples)
- Bearish Harami Candlestick (How to Trade & Examples)
Doji as Reversal Candlestick Patterns
Doji are single candlestick patterns.
There are classic, long-legged, dragonfly, four-price, and gravestone doji.
Almost all doji have the same implications that describe the indecision moments. But a doji after a long trend indicates the weakness of the current direction and can be a reversal candlestick pattern.
Among doji, even though they describe indecisions, the dragonfly is more bullish, and the gravestone is a more bearish pattern.
Related article: All Doji Candlestick Patterns & How to Trade Them
Dark Cloud Cover
Dark cloud cover is a bearish reversal candlestick pattern that has two candles.
The first candle in a dark cloud cover is green which opens at the top of a trend. Then, the next candle opens after a gap-up but closes in the middle or below the first candle.
Related article: Dark Cloud Cover Pattern (How to Trade & Examples)
Piercing Pattern
A piercing pattern is a bullish reversal candlestick pattern having two candles.
And it is the opposite of the dark cloud cover.
The first candle in a piercing pattern is red which opens at the bottom of a downtrend. And the second candle opens after a gap-down but closes in the middle or above the first candle.
Related article: Piercing Pattern (How to Trade & Examples)
Shooting Star
A shooting star is a bearish single reversal candlestick pattern. It is a candle with a tall upper shadow and a small body at the bottom.
The body of a shooting star can be red or green. What matters is the size of its upper shadow. The size of the shadow in a shooting start indicates the counterattack force by bears. So, taller is better.
Related article: Shooting Star Candlestick Pattern (How to Trade & Examples)
Hanging Man
As its name suggests, it is a candle with a long lower shadow occurring at the top of a trend. And it is a bearish reversal candlestick pattern.
While both the hanging man and the shooting star are reversal candlestick patterns, the latter is more powerful.
Relate article: Hanging Man Candlestick Pattern (How to Trade and Examples)
Hammer and Inverted Hammer
Hammer and inverted hammer are bullish single candlestick reversal patterns.
A regular hammer appears at the bottom of a trend. It has a long lower shadow and a small body at the top of the candle.
An inverted hammer also forms at the bottom, however, it has a long upper shadow and a small body at the bottom.
Compared to a regular hammer, an inverted hammer is less potent because bears took control of the market from the bulls in charge before the closure of the session. An inverted hammer indicates that bulls committed to fighting after bears long dominant. So, they may try and win the battle that may result from falling into the rising direction.
Related article: Hammer Candlestick Patterns (Types, Strategies & Examples)
Belt-Hold Candlestick
Belt-hold candlesticks are reversal single candle formations forming at the top and bottom.
The name belt-hold is inspired by how sumo wrestlers compete. In a fight, a sumo wrestler takes the opponent’s belt, holds it, and tries to push him out of the circular ring.
In the price chart, as the new session starts, the price continues in the opposite direction. A bullish belt-hold candle starts at the bottom and continues rising. And the bearish belt-hold candle begins at the top and then falls.
Related article: Belt Hold Candlestick Patterns (How to Trade & Examples)
Tweezers
Tweezers are reversal dual candlestick patterns that have the same top or bottom. One of them is red, and the another is green.
So, there are bullish and bearish tweezers.
In a bullish tweezers pattern, a red and a green candle closes at the bottom of a trend that has the same bottom. On the other hand, with bearish tweezers, both candles have the same top.
There are many types of tweezers. So, make sure to check the following article.
Relate article: Tweezers Candlestick Patterns (Types, How to Trade & Examples)
Counterattack Line
Counterattacks are reversal candlestick patterns. And these patterns consist of two candles.
There are counterattacks at the top and the bottom. The counterattack candlesticks at the bottom are bullish and at the top a bearish reversal pattern.
In a bullish counterattack, the first candle is red at the bottom of a trend. The second candle opens after a gap down but closes at the closing price of the prior candle. In other words, the closing price of the first and the second candle is the same, while the first candle is red and the second a green.
In a bearish counterattack that appears at the top of a trend, the first candle is green. And the second candle opens after a gap-up but closes at the closing price of the first candle.
Related article: Counterattack Candlestick Patterns (How to Trade & Examples)
Upside-Gap Two Crows
An upside-gap two crows candlestick is a bearish reversal pattern with three candles and a gap in the middle.
This pattern starts at the top of a trend with a bullish candle. Then an upside gap occurs. Finally, two red candles complete this pattern.
Related article: Upside-Gap Two Crows Candlestick Pattern (Strategies & Examples)
Three Black Crows
A “three black crows” is a reversal bearish candlestick pattern. It is a pattern containing three candles with relatively large bodies that appears at the top. And then, it is expected to continue falling.
Related article: Three Black Crows Pattern (How to Trade & Examples)
Three White Soldiers
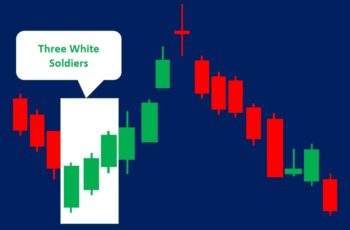
The “three white soldiers” is a bullish reversal candlestick pattern. It is the mirror image of the three black crows.
A “three white soldiers” has three green (bullish) candles that occur at the bottom of a downtrend. After the closure of the third candle green, it is expected the new uptrend to begin.
Related article: Three White Soldiers Candlestick Pattern (How to Trade & Example)
Morning Star
Morning star is a bullish reversal candlestick pattern that has three candles.
The first candle closes red at the bottom of a downtrend. Next, the second candle starts after a gap down and closes either red or green but it has a small body. Finally, the last candle opens after a gap up and closes green.
After closing the third candle as green, it is expected that a new uptrend is going to start.
Related article: Morning Star Pattern (Strategies & Examples)
Evening Star
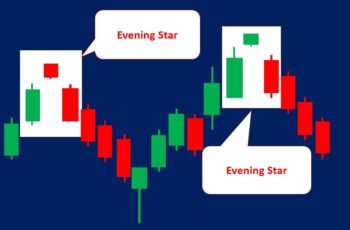
The evening star is a bearish reversal candlestick pattern that has three candles. In other words, the evening star is the mirror image of the morning star pattern.
An evening star begins with a green candle after an uptrend. Then, the new candle starts after a gap up and closes as a small body candlestick. Finally, the third candle opens after a gap down and closes as a red candle that has relatively a long body.
After the third session/candle closed red, investors expect a new downtrend.
Related article: Evening Star Pattern (Strategies & Examples)
Tri-Star Candlestick Patterns
Tri-star candlestick patterns are reversal price chart formations that have three stars. And stars in this pattern are doji or spinning tops.
There are bullish and bearish candlestick patterns.
A bullish tri-star forms at the bottom of a trend. In a bullish tri-star, the first star challenges the power of bears. Then, the second star appears after a ga-down. And finally, the third star appears after a gap-up.
Small gaps and candles with small bodies indicate that the current downtrend may not continue. Instead, a new uptrend will establish.
And a tri-star at the top is the opposite of the bottom version. So, it does need clarification.
Related article: Tri-Star Candlestick Pattern (How to Trade & Examples)
Dumpling Top and Frypan Bottom Patterns
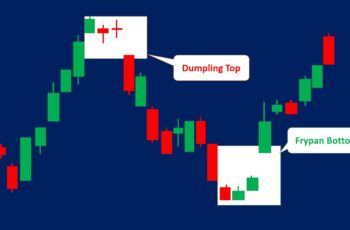
A dumpling top is a bearish reversal candlestick pattern. And a frypan bottom is a bullish reversal candlestick pattern.
These formations are multiple candlestick chart patterns with a gap.
A dumpling top forms at the top which has multiple candles with small bodies. And it completes after a gap-down.
A frypan bottom is the opposite of the dumpling top. At the bottom of the trend, multiple candles with small bodies appear and a gap-up occurs.
Small-bodied candles, generally spinning tops and doji, plus a gap indicates that the prior trend is over. And a new trend opposite to the prior trend will start.
Related article: Dumpling Top Pattern & Frypan Bottom Pattern (Strategies & Examples)
Spinning Tops as Reversal Candlestick Patterns
The spinning top is a candle that has a small body and short shadows.
This pattern indicates the weakness of the trend if it appears in an extended uptrend or downtrend. And after an extended trend, it is a sign of reversal.
Remember that spinning tops should appear after a long trend to signal weakness. It is not a reversal sign in the middle of a trend, instead, it is a sign of pause and could be a continuation sign.
Related article: Spinning Top Candlestick Patterns (Strategies & Examples)
How to Trade Reversal Candlestick Patterns?
All reversal candlestick patterns are not the same. Each has its features and implications.
So, there is no clear-cut way to say how to trade reversal candlestick patterns
However, some factors can be applied to all of them.
This article does not provide examples of reversal candlestick patterns. So, I suggest you visit the related articles.
Here are those mutual factors:
- Wait for the last candle of the pattern closure: You should wait because a candle says nothing till it is closed.
- Combine other technical tools and techniques: Blending candle charting techniques with traditional chart patterns and adding an indicator such as momentum helps to analyze better.
- Read related news and check the economic calendar: News can act as confirmations and the economic calendar helps your entry and exit points.
- Candlestick patterns work better in the stock market and the daily and higher time-frame charts.

James njuki
I love to know about trading
it’s a great experience
Zafari
Thank you, James,
We appreciate your comments
Oliver
Finally, trader’s candlesticks are not copied from the Internet, but intelligently and grouped by target! Perfectly presented material, thank you!!!