Continuation patterns express periods during which the price chart needs to correct itself before the start of rising or decline. And they are also known as consolidation/correction patterns/formation/structure.
Generally, continuation patterns move sideways or go sideways, unlike reversal patterns in which the price changes direction/trend. However, it is ok if they tilt somehow upward or downward.
A consolidation formation that completes in an uptrend is known as a bullish continuation pattern. On the other hand, a consolidation formation that finishes in a downtrend is called a bearish continuation pattern.
Recognition of consolidation periods is the most vital technique differentiating a winning trader from a loser. So, investors need to learn and implement specific strategies to make better trades.
This article introduces you to the 10 most reliable consolidation formations every trader should learn. Moreover, it introduces you to related article/s that explain and give examples.
1. Flag Patterns
A flag pattern is a continuation pattern that appears in a sharp downtrend.
The flag that forms in an uptrend is bullish. And when a flag appears in a downtrend, it is a bearish pattern.
In a flag pattern, the upper line goes parallel to the lower line. And its height is short.
Moreover, flags are short-lived. So a sharp downtrend or uptrend is necessary when these types of formations form.
The following image shows how a bullish flag develops.
Theoretically, a bearish looks like this.
Related article: Flag Pattern: Types, How to Trade & Examples
2. Pennant Patterns
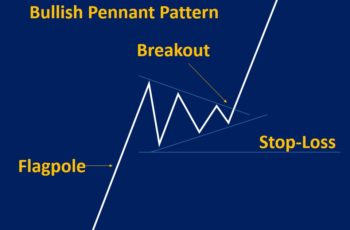
A pennant pattern similar to a flag occurs in a sharp up or downtrend. So, it is a short-lived continuation pattern.
Visually, a pennant is similar to a symmetrical triangle but so small that fluctuations are negligible.
In a flag pattern, as the pattern develops, from left to right, the lower line rises, and the upper line falls.
A bullish pennant looks like the following.
And a bearish pennant develops like the following.
Related article: Pennant Pattern: Types, How to Trade & Examples
3. Triangle Patterns
Triangles are continuation patterns that look take longer time than pennants to develop. Some triangles are large enough to enable traders to trade inside formations.
There are many types of triangles, and they are symmetrical, ascending, and descending triangles.
What differentiates these patterns are the upper and lower line of the pattern from left to right as patterns form.
In a symmetrical triangle, the upper line falls and the lower line rises.
In an ascending triangle, the upper line is flat and the lower line ascends.
In a descending triangle, the upper line falls and the lower line is flat.
Generally, all triangles are consolidation formations. However, any of them can be a reversal if appears after an extended trend. Specifically, a descending triangle after a long uptrend is more likely to be a bearish reversal pattern, and an ascending triangle after a long downtrend is more likely to be a bullish reversal formation.
Related article: Triangle Pattern: Types, Trading Guide & Examples
4. Wedge Patterns
Wedge patterns are continuation patterns in which both trendlines are falling or rising.
There are two types of wedge patterns, rising and falling.
In a rising wedge, both trendlines rise as the pattern form, while in a falling wedge fall.
Generally, a rising wedge is bearish, and a falling wedge is a bullish continuation pattern. However, a rising wedge after an extended uptrend is a bearish reversal, and a falling wedge after a long downtrend is a bullish reversal pattern.
Here is how a rising wedge continuation pattern develops.
Related articles:
- Wedge Pattern: Rising & Falling Wedges, Plus Examples
- Broadening Wedge Pattern: Types, Strategies & Examples
5. Rectangle Patterns
A rectangle pattern is a continuation pattern in which the price fluctuates sideways.
In other words, a rectangle is a formation in which its support and resistance lines are flat. However, a tiny slope of trendlines is accepted.
Generally, rectangles take longer time than flags to develop and a sharp trend is not necessary. Moreover, rectangles’ height is taller than flags.
A rectangle that appears in an uptrend is bullish. And a rectangle that forms in a downtrend is a bearish pattern.
The following shows how a bullish rectangle pattern develops.
And a bearish rectangle like this.
Related article: Rectangle Pattern: Types, Trading Strategy, Features & Examples
6. ABCD Patterns
An ABCD is a correction pattern that can be bullish or bearish.
This pattern is the same as the corrective wave in the Elliott Wave Theory, in which it has three waves.
Those who know this pattern as an ABCD, mark its pivot points from A to D, while in the Elliott Wave Theory analysts count the waves/moves.
Anyway, a bullish ABCD continuation pattern looks the following.
And a bearish ACBC like this.
Related article: ABCD Pattern: Trading Strategy and Examples
How to Trade Continuation Patterns?
Evert continuation pattern has their stories and techniques. So, this article can not cover all of them.
However, some things are applicable in all correction patterns.
And they are:
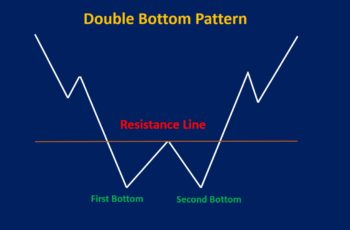
- Always wait for a breakout: Every continuation pattern completes only when the price breaks and closes the upper or lower line of the formation. For example, in a rectangle pattern, you should wait for a breakout because the formation of a reversal pattern, such as double top or bottom, and triple top or bottom patterns is likely.
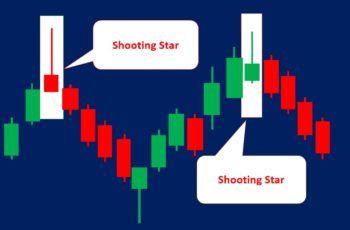
- Study inside the pattern: Inside a pattern, multiple chart formations or candlestick patterns form. And they are helpful. For example, a shooting start near the upper line of the pattern or a bullish engulfing pattern near the lower line of the pattern is a powerful confirmation.
- Blend your analysis with fundamentals: Reading news and reports are great ways to make better decisions. They help you to calculate your risk/reward more effectively. And most importantly, reading fundamentals reduces your emotional reactions.

![Diamond Chart Pattern Explained [Example Included] Diamond Chart Pattern Explained [Example Included]](https://srading.com/wp-content/uploads/2022/12/diamond-chart-pattern-top-350x230.jpg)