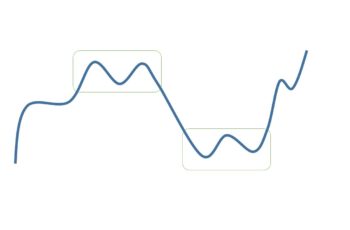
A rounding top pattern is a bearish reversal structure forming at the end of an uptrend. And visually, it resembles a simple curve that starts rising and then falls.
Appearing this structure began with an uptrend, in which bulls are in control. However, bears start taking control slowly and forming a rounding turn, which makes it clear that a downtrend is coming.
This pattern is the mirror image of the rounding bottom pattern. Compared to the rounding bottom, it takes less time and forms less frequently.
A rounding top pattern does not form as often as other reversal top structures, such as double top, and triple top patterns. And it does not provide a clear clue on when and where to go short. So, trading this pattern requires more experience.
Rounding tops often form on index charts. It rarely appears at the top of a trend in a stock chart.
Rounding Top Pattern Mirrors Fundamentals Struggles
Rounding patterns, both bearish and bullish versions mirror fundamentals. And investors react to economic data, which forms this pattern gradually.
For example, the unemployment rate, and the interest rate may rise gradually, and investors react to them. These actions and reactions will change direction slowly.
If the chart is a stock, it may reflect the underperformance of the related company. And if it is an index chart, it reflects the whole economic struggle.
Entry and Exit Points of Rounding Top Pattern?
A rounding top pattern forms by making new higher highs followed by lower lows, in which the ranges price between highs and lows is small.
Rounding top patterns can be almost perfect round or an imperfect head and shoulders top.
First, because this pattern forms in higher time frame charts such as a weekly chart, see inside the structure. You may find great entry points in lower time frames, such as daily and 4-hourly charts. So, it is worth going at lower time frames for analysis.
Second, the support line is the level that the rounding top started. Breaking this line by the price can be sharp or make a bearish correction pattern. You can go short if a tall green candle breaks the support line and closes its below and if you have enough confirmation.
However, if the price breaks the support with low volume (small candle), wait for a bearish continuation pattern because the trend reversal is not confirmed yet. Always trade with the trend.
Finally, the stop loss should be above the pattern or at the top of a bearish consolidation structure.
Round Top Pattern Examples
Example #1
The CAC 40 index (French stock market index) made a rounding top pattern from early 2000 to early 2001.
The bears started fighting in early 2000 as shown by the MACD indicator at the bottom. Then, an evening candlestick pattern appeared at the top of the pattern and started falling from there.
This rounding top fell gradually and did not break sharply the resistance line. So, waiting for a pullback was a good idea as it did happen later.
As mentioned earlier, a rounding top indicates the performance struggles of the economy (shown in an index chart). This pattern exactly formed during the existence of economic problems. In March 2000, the .com bubble burst in the USA, and the recession spread around the world, including in France.
Example #2
The S&P 500 index made a rounding top pattern in a weekly chart that lasted from early 1999 to early 2001.
This rounding pattern made an imperfect version of the head and shoulders top as shown by LS (left shoulder), H (head), and RS (right shoulder) at the top. However, many investors may not see it as a head and shoulders.
Anyway, the price broke the resistance line and made a pullback followed by declining.

