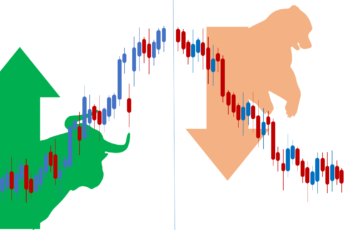
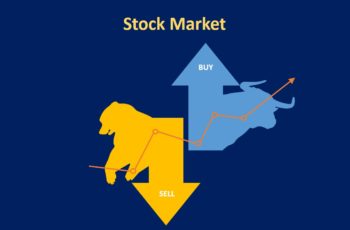
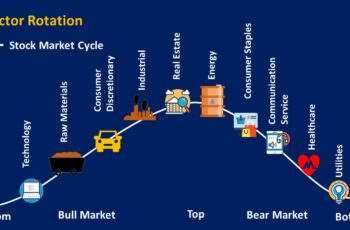
A stock market bubble refers to a situation when the price of stocks grows very high without underlining fundamental reasons.
Some bubbles lead to recession, and some do not.
A single asset also can be in a bubble. For example, the bitcoin bubble in 2017 did not impact other assets. However, this article means the situation when the whole market is in a bubble.
In a stock market bubble, it seems investors put money in the stock market without a convincing justification because others do as well, and the price goes up and up.
The initial cause of a bubble can be anything and can start from any industry and spread to others. In a stock bubble, no one knows when a bubble ends. However, some investors may find the cause and benefit from the burst.
Stock Market Bubble Stages
A stock market bubble does not occur immediately. It develops in a series of stages or phases.
Economists have divided the process of bubble development into five stages. It starts with the displacement of funds and ends with panic.
1. Displacement Stage
Displacement means that investors (or speculators) move (displace) funds to new technology, products, or any exciting thing.
For example, in the .com bubble, investors got excited and poured a lot of money into buying shares of websites.
2. Price Boom Stage
As investors continue pouring money buying stocks, the price will have only one direction. And that is to go up and up.
Prices continue going up because the supply is not unlimited. Specifically, when everyone wants to have something, the supply will become limited automatically. And according to the supply and demand principle, when the supply is limited and the demand is high, the price will continue rising.
3. Euphoria Stage
As the stocks go higher investors get thrilled. The current market participants add to their positions, and new investors enter the market. They all push the stock price even higher.
In a bubble emotions also play a role. New investors enter the market because they feel like missing out.
4. Profit Taking Stage
Of course, nothing lasts forever. Some investors understand that the stock market is in a bubble. They sell their stocks with huge profits and sometimes even promote their opinions to increase their profit. News of the bubble spread across the market.
5. Panic Stage
Finally, investors get panic and rush to the stock market selling their stocks that end in a burst. And understand that they wrong pricing assets that were in a bubble.
Again, because the supply increases and there is not enough demand, the price will continue falling.
Signs of a Bubble
The existence of a bubble is subjective. All investors do not agree. That is why bubbles develop and burst.
However, some signs may convince some that a bubble exists.
Here are four of them.
1. Fundamental Do Not Confirm The Market Price
Traditionally the stock price is examined using economic and performance indicators of companies.
Examples of economic indicators are GDP, inflation, interest rate, etc. And examples of a company’s performance indicators are earning per share (EPS) and revenue growth rate.
In a bubble, the market price is higher than the price of assets if analyzed using fundamental tools.
Emotion plays a huge role. It pictures in the mind of investors many potentials that later turn out to be wrong. For example, in the .com bubble investors were buying shares of a website without a proven business model, and investors believed in it emotionally, not based on calculation.
2. Too Many New Investors Enter the Market
People do not like to be left alone.
Specifically, young people are looking for a quick get-rich scheme.
New investors that enter the market are more excited. They want to get rich fast. And they are willing to take more risks.
New investors, plus those who have been in the market, push the price of hot assets higher. This trend continues till the bubble burst.
3. The Bullish Sentiment Is High
The bullish sentiment among investors is high. They describe the economy as healthy and with good prospects for companies.
4. Using High Leverage By Investors
Leverage helps to make big deals. At the same time, it increases the risk.
Investors to profit more, use high leverages.
Specifically, today using leverage is much easier than in the past. Currently, brokers provide leverage based on the deposits of their customers. And it is just a matter click, or touching the screen of a smartphone.
Examples of Bubbles
Any asset can be in a bubble. Some of them cause economic pain and some do not.
This article explains the Dotcom bubble and housing bubble as examples.
Dotcom Bubble
The Dotcom bubble in the US started in 1995 and ended in 2000. Investors call it Dotcom bubble because most companies that caused were internet-based companies having a .com domain.
Some .com firms survived, and some went bankrupt. Notable companies that went bankrupt are pets.com, Webvan.com, and boo.com. And some of those that survived are Amazon, Microsoft, and CISCO.
The NASDAQ Composite is a stock market index that tracks the price of almost all stocks listed on the NASDAQ stock exchange. And most internet-based companies are listed on this stock exchange. From early 1995 to early 2000, the NASDAQ composite rose 582%, fivefold in five years. It took the NASDAQ composite more than one and half decades to reach the highest level of the Dotcom bubble.
2008 US Housing Bubble
Investing in internet-based companies proved to be risky. After 2000 and before 2008, people in the USA started looking for other assets to invest which is safer. And this bubble caused a global market crash in 2008.
And, investing in real estate seemed safer.
Due to the credit easing policy, people with low credit scores were able to buy homes. Because it seemed safer and growing investment, people rushed to buy homes.
The prices of homes did not continue rising. Some people (specifically those with low credit scores) became unable to pay their mortgages and lost their homes. Then, there were too many houses for sale but not enough buyers. The housing market collapsed and caused the financial market and other sectors to collapse too.
The FHFA House Price Index (FHFA HPI®) tracks changes in single-family home values from all 50 states and over 400 American cities since the mid-1970s
The FHFA House Price Index started declining in 2007 and continued for years before reaching the same level in 2016.
source: tradingeconomics.com
Bottom Line
Any asset can be in a bubble.
If the industry which is in a bubble is huge, it will cause a stock market crash. If not, it may not cause big damage.

