A rounding bottom pattern is a reversal bullish chart structure that forms in which bulls take control of the market slowly. Once the bulls prove to be stronger, the slope of the new uptrend will be steeper.
Rounding bottom patterns are also known as saucers or bowls because they look like them. And it is the mirror image of the rounding top known as the inverse saucer too.
In a perfect rounding bottom, buyers dominate over time without big volatilities. In other words, bears lose and bulls gain powers over time. However, most rounding bottoms are similar to the reversal head and shoulders. You see examples in the following.
Rounding bottoms do not form as frequently as other reversals, such as the triple bottom, and trading it is more difficult because of unclear entry and exit points.
Rounding Bottom Pattern Reflects the Fundamentals
You find rounding bottoms more in index charts and reflects macroeconomic indicators. In the following, our examples are from indexes too.
Because these patterns reflect fundamental data changes such as CPI, interest rate, and fiscal policy, it tends to form gradually.
If the economy is healthy, fundamentals change slowly followed by the development of the rounding bottom. And, if the macro data turn out to be promising, and investors embrace them, then the move will be sharp.
Rounding Bottom Pattern Entry and Exit Points
As mentioned earlier, this pattern is sometimes like an imperfect inverse head and shoulders or even another structure. And these “inverse head and shoulders” have shorter heights and tilted resistance lines.
So, looking inside the formation and candles gives some clues about expectations.
If the rounding bottom is a clear round structure with fewer volatilities, then the level that the pattern started could be the buying zone. And place the stop loss below the pattern.
When it comes to take a profit, there is no clear point to order. Based on our experience, it is better to look for another pattern before closing our position. We will adjust our stop loss if the bullish continuation patterns form and will close it if a convincing bearish reversal forms.
Examples of Rounding Bottom Pattern
This article provides you with two examples from the dollar index and amazon stock.
Example #1
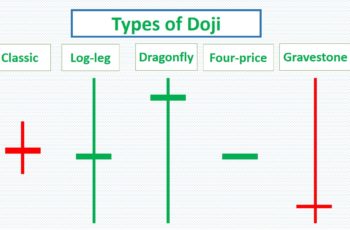
In late March, the USD index (DXY) daily chart, started following the formation of a long-legged doji. This downtrend began at 93.5 and ended at 89.5.
It started forming a rounding bottom in early May and was completed in mid-June.
And in mid-June, the chart continued to rise. During this trend, the price fluctuated, however it reached 94.50.
Example #2
In the second half of 2000, Amazon stock began falling. This trend coincided with a series of interest rate cuts by the Fed reserve, which resulted in the stock market collapse.
As a result of the recession, there was a fight between bears and bulls, in which the buyers took control slowly, making a rounding bottom pattern.
This rounding bottom resembles an imperfect inverse head and shoulders. In the following chart, the left shoulder is marked by LS, the head by H, and the right shoulder by RS respectively.
After the completion of this pattern, a small bullish correction appeared, which eventually continued rising till a double top formation reversed the trend.
Differences Between Rounding Tops and Bottoms
Both of these patterns occur less frequently than other structures. And both of them occur in larger time frames, for example weekly.
However, there are some differences.
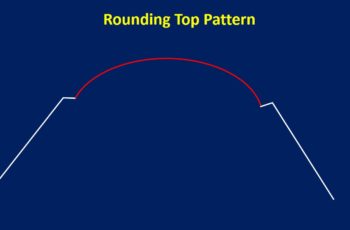
First, a rounding top is bearish, while the rounding bottom is a bullish reversal pattern.
Second, a rounding top takes less time to develop, while a rounding bottom takes longer.
Finally, a rounding top predicts a weak performance of the economy or the related company, while the rounding bottom forecasts a good performance
Final Words
A rounding bottom is a bullish reversal structure that is not popular as double bottom or other reversals.
This pattern often forms as the economy or a company’s performances create a trust over time and slowly.
Trading this pattern due to not having a clear formation is more difficult than others. So, looking for more data and confirmation is necessary.

