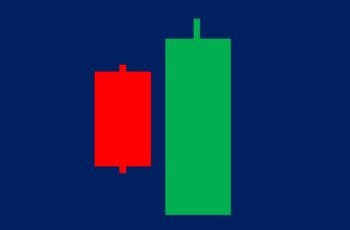
What is Bearish Harami?
A bearish harami candlestick is a reversal pattern suggesting a future downtrend. It forms at the top or end of a bearish correction structure.
This pattern is a combination of two candlesticks. The first candlestick is a tall bullish (green), and the second candle is a small green or red candle.
If the second candle is a doji, it is called a bearish doji cross.
A bearish harami after a rally means that the market is exhausted. It may reverse. Moreover, the chance of reversal increases, if there are other technical and fundamental signals.
The opposite of the bearish harami is the bullish harami which appears at the top.
How to Trade Bearish Harami?
Due to its small second candle, a bearish harami requires more signals, or a few but potent.
So, before an investor trade this pattern, he should consider the following things:
- A bearish harami should appear after an uptrend. For example, if it appears after a reversal it has almost no meaning.
- A long first candle conveys more power. It indicates that the volume is high and more market participants are active.
- If the second candle closes near the bottom, it is an indication of power, and better for reversing the trend.
- A smaller second candle with small tails, such as a doji is better. That is why a harami cross is more reliable.
- A bearish harami immediately after a trend reversal signals a consolidation than a reversal.
- Combine a bearish harami with other technical charting techniques such as patterns and indicators.
- Check the economic calendar and fundamentals. Confirmation from a fundamental perspective reduces your emotional decisions. Thus, helps you to trade with less emotion.
Bearish Harami Examples
In this post, I posted three examples. The first two succeeded in bringing down the price. However, the last example did not.
Example #1
On 20-21 Oct 2021, the Pinterest stock chart made a bearish harami pattern. This pattern was successful, and the market collapsed after that.
Reasons that this harami pattern predicted the collapse of Pinterest stock are the following:
- On 20 Oct 2021, there was huge news about Pinterest. For example, New York Times titled “PayPal Is Said to Be in Talks to Buy Pinterest in $45 Billion Deal.” And Bloomberg reported about it too. Because the deal was not made, its price could not continue going up, except on the day of the report. A screen of news search is provided below.
- The first candle of this harami is tall. A taller candle in a harami pattern makes it more potent;
- The second candle in this chart is short. Additionally, the second candle has small tails, another reason for its strengths.
- In late July, there is a big gap (window), and the price could not penetrate it on 20 Oct 2021. Technically, windows are more potent than candle patterns.
- Before this harami pattern, the momentum indicator, which is a leading indicator, did not show an oversold condition. If the market is not oversold, then buyers may not be in control.
Example #2
In early September, Goldman Sachs completed a bearish harami. Technically, because the second candle closed above the middle of the first candle, it was not very promising. However, many other signals support this pattern.
Those signals that support the above bearish harami are the followings:
- A shooting star 12 sessions earlier could not close above the resistance line created in late August. It is a sign that bulls are losing and bears are getting momentum.
- Eight candles later another bearish candle tested this area but failed.
- If the shooting star and the strong resistance area are not enough, the next candle after the bearish harami opened after a gap-down. It should clear any opposition to short.
If you are short in situations like the above, put a stop loss above the harami structure.
Example #3: Failed Example
Microsoft chart from 17-18 and 28-29 of Jun 2020 made two harami patterns.
However, non of them worked.
Here are the reasons that prices failed to reverse after these harami candlestick patterns:
- There is no major supporting signal, except a relatively weak support area. For example, the momentum indicator was not an area to be considered an overbought situation.
- The first pattern did not occur after a big rally. The second pattern formed after a rally but was not strong because the first candle was not tall and the second candle formed near the top of the first candle. In a bearish harami pattern, if the first candle is tall and the second candle opens and closes near the bottom, it has more strength.
- The second candle of this pattern opened and closed near the top of the first candle. It is like a continuation pattern.
- There was not any news that degrades the stock price of Microsoft. I googled.
Based on the above reasons, if you see a similar pattern to them, you have to confirm it with other tools. There were not sufficient pieces of evidence, and the stock price did not fall.
Anyway, if you sell in situations like this, put a stop-loss above the pattern. You may lose. It’s OK in trading to lose sometimes. Cutting loss is better than the continuation of loss. So, do not forget to put a stop-loss.
Bottom Line
Bearish harami is a reversal candlestick pattern and the counterpart of the bullish harami. It forms at the top and suggest a downtrend.
This pattern is not as reliable as bearish engulfing pattern and dark cloud cover. So, look for more supporting signals.

