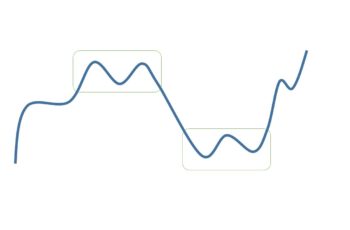
A double bottom pattern is a bullish reversal chart structure that appears at the bottom of a chart.
It is the mirror image of the double top pattern. Later in this article, you read about differences. Now keep reading.
A double bottom pattern starts with a downtrend. Then reverses upward, making the first bottom, but fails to continue rising to create the resistance line of the formation. Next, the price falls to almost the same level as the first bottom, completing the second bottom. Finally, the price changes trend upward and break the resistance line to complete the double bottom pattern.
Note that a double bottom is complete only if one or two candles close above the resistance line. Before that, no one can surely say if it is a double bottom or not.
And before breaking the resistance a pattern can a bearish continuation pattern.
For example, a pattern that looks like a double bottom can turn out to be a falling flag.
Or, it can be a falling triangle.
How to Trade Double Bottom Pattern?
Double bottoms are reliable reversal patterns if traded correctly.
Trading correctly means an investor should deeply study the chart and fundamentals and decide without emotion.
In general, it is more likely a trend to continue than reverse. And this article explains the factors that influence this pattern.
Study Inside the Double Bottom Pattern
There are patterns inside a pattern and trends inside a trend.
So, looking inside a double bottom pattern is essential, and you should not forget.
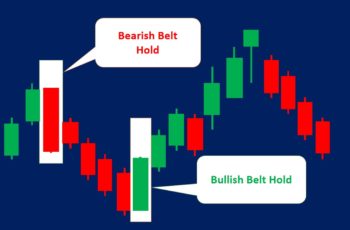
Moreover, look at candlestick patterns inside the structure because they warn earlier than chart formations.
The Height and Width of the Double Bottom Pattern Matters
Like all other reversal and continuation patterns, the size of the double bottom structure does matter.
The taller the height and wider the width leads to a bigger change after the completion of the pattern. And shorter heights and shorter widths mean less reliability.
Placing Trade Order
An order should be where the winning probability is high, and the risk is low.
So, always examine the risk and rewards of a trade.
The first place you can buy in this pattern is after breaking the resistance line where the pattern officially forms. However, it carries more risk and trade here if the new uptrend is sharp and a large green candle breaks the resistance line.
The second method is to wait for a pullback after breaking the resistance line. However, it may not happen at all. So, examine the chart more deeply, and try to find pieces of evidence as much as possible.
Taking Profit Order
The minimum take profit will be equal to the height of the pattern. However, we recommend at least a risk-reward ratio of two. In other words, your profit target should be two times bigger than the height of the structure.
Another better method is to adjust your stop-loss as the uptrend continues till you discover a new bearish reversal pattern or the price hit your stop-loss. This method is superior because it lets your profit go, at the same cut your loss, or even closes your position with a huge profit.
Fundamentals Reduce Your Emotional Trades
Economic data such as CPI, money supply, and taxes play huge roles. They sometimes can change market directions instantly because investors react to them.
When you have a technical chart pattern and fundamentals confirm it, you will profit more and manage your emotions better.
Never forget to play with the economic calendar and read the data history graph.
Examples of Double Bottom Pattern
This article provides two examples, from the forex market and the stock market.
Example #1
In the weekly chart, the EURUSD forex pair made a double bottom pattern.
The second bottom made a bullish engulfing candlestick pattern and then the price continued rising and breaking the support line of the structure.
After breaking the support line the price made a small pullback which is expected to happen most of the time.
This trend continued rising for more than a year. And the first reversal warning was a bearish harami candle pattern. During this time, the momentum indicator also warned of a reversal, and it happened months later. (look at the bottom of the chart)
The buying order could be both after breaking the support line because the reversal is sharp and after a pullback. Note that this pattern only completes after closing above the resistance line.
Example #2
In early November in the hourly chart, Microsoft stock made a double bottom chart.
The price started rising from the second bottom with a bullish hammer. Then, the price continued breaking the resistance line and making a pullback followed by a “rising three methods” candlestick pattern. Finally, the uptrend finished by making a hanging man candle.
Because a large green candle broke the resistance line, it was a good place to go long or after the pullback.
As the Relative Strength Index showed an overbought condition, it was time to be careful. Since, there were two gaps the chance of going up further was more likely, even though the RSI is in an overbought place. And taking profit from the $218 level above was a good idea.
Differences Between Double Top and Bottom Patterns
These two formations have the “double” word. Both are reliable.
However, there are some differences.
- The double top pattern is a bearish reversal structure while the double bottom is a bullish reversal
- In the stock and crypto markets, often, a double top pattern takes less time to form than the double bottom
- In the stock and crypto markets, the double bottom requires larger candles (or higher volume) to reverse the trend
Find Double Bottom Patterns in the Following Charting Tool
The following chart provides live data and tools to study price action.
Click on the pencil icon to draw patterns.
Moreover, you can insert this structure by clicking on f(x) >> Pattern Recognition >> Double Bottom Pattern. However, it will only select the perfect formation. But you need to be flexible and give room to variations because a perfect pattern rarely forms.

