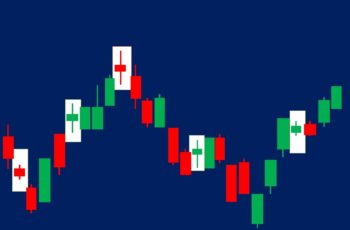
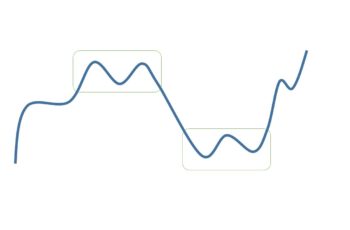
A pennant pattern is a continuation chart pattern that appears in the middle of a trend.
Pennant patterns resemble symmetrical triangles. However, they are small and short-lived structures.
In terms of development time and implications, pennants are similar to flag patterns. But pennants appear less often.
There are two types of pennants, bullish and bearish. And are among the most trustable among chart patterns.
Bullish Pennant Pattern
A bullish pennant pattern appears in the middle of an uptrend. It suggests that the upward direction will continue in the coming sessions.
It starts with the flagpole, a sharp uptrend. Then, the price fluctuates but decreases as it develops. Finally, the price breaks the declining resistance line of the pattern.
Bearish Pennant Pattern
A bearish pennant pattern forms in a downtrend. It suggests the continuation of the downtrend.
It starts with a sharp downtrend known as a flagpole. Then, the pennant develops, which resembles a symmetrical triangle but is small in size. Finally, by breaking the rising support line of the pattern, it is finished.
In the stock and crypto markets, bearish flags take less time to develop than bullish flags. They take less time because of panic associated with downtrends in the stock market.
However, in the forex market, there are no differences.
How to Trade Pennant Patterns?
Pennant patterns are among the most reliable chart structures because they form in the middle of a sharp trend.
However, they do not appear very frequently as flag patterns.
Here are things to pay attention to when you discover pennants:
- Flatter pennants are more reliable and easy to find.
- A technical indicator such as momentum helps to time better.
- Check inside the pattern in lower time frames. It helps to lower risk by putting a tighter stop-loss or avoiding an unhealthy structure.
- Look for candlestick patterns inside the pennants.
- Blend your technical analysis with fundamentals. It helps you to find other confirmations or rejections. And check the economic calendar.
- Put a stop-loss below the support line of the bullish pennant, and above the resistance line of the bearish pennant.
- If you like to put a take-profit order, the distance from the order point to the take-profit should equal the flagpole range.
Examples of Pennant Patterns
Example #1: Bullish Pennant Pattern
In May 2018, Amazon stock made a bullish pennant pattern.
The flagpole of the pennant was a gap-up spike. And it also precedes a strong bullish trend.
During the development of the pennant, the volume decreased, but the price did not fall. It is a confirmation of taking profit by some bulls.
At the end of the pennant, a green candle engulfed the prior red candle. It is not a perfect engulfing pattern, however, it is a sign of the uptrend strength.
Finally, the price breaks the resistance line of the pattern and completes it. Moreover, the volume gradually increases.
Example #2: Bullish Pennant Pattern
In late July, Amazon stock completed a bullish pennant pattern.
The flag of the pattern was a sharp move. Then, the body made small waves. And finally, a green candle broke the resistance line of the pattern after a gap-up.
Moreover, the earning report helped the price to break the pattern. And sales were up 39%. It indicates the importance of fundamental analysis in combination with fundamental analysis h technical analysis.
Example #3: Bearish Pennant Pattern
Meta stock made a bearish pennant after breaking the support line of a triple-top pattern.
The flagpole of the pattern was not sharp however, it was after a reversal pattern.
At the end of the pennant, there is a doji candle, a sign of indecision. The next candle opens after a gap down and closes far below, which is another confirmation of the downtrend.
Check What You Learned in Real Chart
You can insert drawing tools by clicking on the pencil icon in the middle of the top of the widget.

