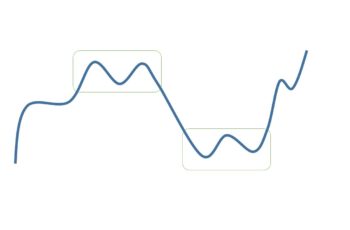
Tweezers candlestick patterns are reversal chart structures, having two or more candles in which the high or low prices are the same. It means that there is powerful support or resistance line.
In terms of location, there are two types of tweezers: top and bottom. The tweezers top patterns are bearish, and the tweezers bottom are bullish patterns.
In a tweezers top, the highest session prices of the two or more candles that make the structure are the same. And, in a tweezers bottom, the lowest prices of pattern’s candles are the same.
Ideally not a must, the first candle in a tweezers top should be green, and the second red or a doji. Contrarily, ideally, the first candle in a tweezers bottom should be red, and the second a green or a doji. Meanwhile, both candles can have the same color when one of them is a doji or has a small body with tall shadows.
The tweezers pattern name comes from the tool that helps you to pick up tiny things. Tweezer (without “s”) is not correct.
Tweezers do not occur often, so they need more confirmation than other candlestick patterns.
The strength and weakness of a tweezers depend on the shape of the candles that make the pattern. And you read them in this article.
In this article, I explain the types of tweezers, how to trade them, and give some examples.
How to Trade Tweezers Candlestick Patterns?
The shape and range of candles in tweezers do matter. And, they dictate to us how to trade.
The followings are factors that you have to consider before trading any tweezers:
- There should be a trend, or tweezers should appear at the end of the correction wave to predict a reversal.
- The size of the constituents’ candles is crucial. Generally, taller candles are more potent due to higher volumes.
- A tweezers structure has more power in a higher time-frame candle, such as weekly. It has more power because investors consider support and resistance lines more seriously in high time frames than in short time frames such as hourly. And investors’ beliefs define the market direction. Moreover, the same high or low prices in short time frames such as hourly means nothing.
- The closing price of the second candle near the opening price of the first candle is better. It means rejection. If the second candle closes near the closing price of the first candle, it means hesitation and a lower chance of reversal.
- Check out the economic calendar. Checking macro news events can help you a lot. Moreover, blend it with fundamental analysis.
- Look at the chart to see if there are signals that reject or confirm your tweezers pattern. These signals can be from the chart pattern side or a technical indicator.
- Be flexible in defining tweezers. It is hard to find perfect tweezers. It does help your analysis if the top prices of candles vary a little bit.
- If a tweezers, fail to change the direction of the market, the previous trend will continue in its direction. That is why you need supporting signals to trade this pattern.
- After confirmation of the reversal, the high prices of tweezers top and low prices of tweezers bottom become resistance and support lines respectively. And put your stop loss above tweezers tops and under tweezers bottom.
- If there are sufficient pieces of evidence, go long after completion of a tweezers bottom and sell after a tweezers top. Close your trade if you have an open position against one of these patterns.
Consider the above factors for every tweezers.
However, some things influence only a single type of tweezers.
In the following, I explain each type of tweezers with examples.
Doji Tweezers Candlestick Patterns
In a doji tweezers top and bottom, one of the candles is a doji.
The doji in a tweezers top that opens and closes near the bottom of the other candle is more reliable, and near the top in a tweezers bottom.
Tweezers top with a doji is a bearish pattern. And tweezers bottom with a doji is a bullish structure.
Compared to a single doji, tweezers with doji are more powerful. A tweezers with a doji tells that there is one more confirmation than just a doji. And, that is the first long candle that failed to continue its direction.
Example of Doji Tweezers
In the second half of October (in the following chart) the Tesla stock made a tweezers. The new trend established by the tweezers bottom ended with a tweezers top.
In this tweezers, the first candle is red with a long low shadow, and the second candle is a doji.
The first candle of this pattern has a lower shadow, and this means that bulls were struggling and bears fighting to take control. Finally, the bears proved to be superior.
Moreover, before this pattern, the Tesla stock made many attempts to fall further and failed. This failure is another sign that bears are serious about pushing the stock upward.
Based on the above argument, buying in the above situation is a good idea, and it should be followed by putting a stop loss under the pattern. And, an open short position should be closed.
Engulfing Tweezers Candlestick Patterns
Those tweezers that look like engulfing patterns, I call them engulfing tweezers.
Bearish engulfing tweezers are bearish patterns, forming at the top. And bullish engulfing tweezers are bullish patterns, forming at the bottom.
The difference between “tweezers engulfing” and “normal engulfing patterns” are in the high and low prices of candles. In tweezers, the high prices of candles in engulfing tweezers top, and the low prices of candles in engulfing tweezers bottom should be the same.
The features of tweezers with engulfing patterns are the same as real “engulfing patterns.” We have an article dedicated to engulfing structures. Click HERE to read it.
Engulfing Tweezers Example
In the following chart, the Tesla chart made three tweezers.
However, I only talk about the bullish engulfing tweezers.
In the following chart, in mid-march, a tweezers started a new uptrend and ended with a bearish harami tweezers. (I do not talk about this here)
And in early April, a downtrend started with a tweezers and was stopped by a bullish engulfing tweezers on 15 March 2022.
There is a long downtrend before this pattern. Any trend will end, at least to correct itself. And, this was a supporting signal for the bullish engulfing tweezers.
The Commodity Channel Index (CCI), at the bottom before this pattern, signaled a reversal by not following the trend. When a leading technical indicator goes another than the price chart, it is a warning of reversal.
The tweezers formed near a round number price, which is 200 here. Psychologically, round numbers affect traders’ decisions and become support or resistance lines. And, the $200 price for the Tesla stock played a supporting line role.
Based on the above reasons, from the risk/reward perspective, it was a good time to place a long position or close an already short position. And, the stop loss under the tweezers was necessary.
Hammer and Shooting Star Tweezers
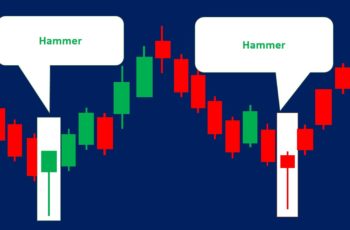
Tweezers, in which one of the candles is a hammer, some (and I) call it hammer tweezers. It is a bullish candlestick pattern that forms at the bottom of a trend.
The longer the real body candle and the longer the shadow of the hammer lead to more bullishness.
A shooting start tweezers is a bearish candlestick pattern forming at the top of a trend. In this pattern, one of the tweezers’ candles is a shooting star. The longer the body of the real candle and the longer the upper shadow of the shooting star lead to more bearishness.
Since shooting star tweezers has one more confirmation for reversal, it is more potent than shooting star patterns. And hammer tweezers have more strength than a single hammer pattern, due to the first candle that confirms support or resistance.
Hammer Tweezers Examples
On the 14th and 15th of October, the JP Morgan stock chart made a hammer tweezers bottom. This tweezers is also a bullish engulfing pattern.
In this tweezers, the first candle is a red hammer, and the second candle is a tall green candle. The red hammer says that in this session, the bears tried to push the price down, but bulls fought back hard closing the price where it opened. Bears tried once more the next day, opening price after a gap down, but this time bulls fought back harder closing the price above the high price of the previous day.
The above tweezers have more supporting signals. A few days before this pattern, a doji tweezers also signaled the weakness of the downtrend. Moreover, it formed after a pullback which is normal after start of a new trend.
The above hammer tweezers look risky. And should be traded with caution. If you trade tweezers like the above, don’t forget to put a stop loss under the tweezers.
Shooting Star Tweezers Example
In the following chart, in the second half of April, the Netflix chart made a shooting star tweezers.
This tweezers has three candles.
The first candle is a large bullish candle that closed near its high. It means that the bulls were strong. On the second day, the price opened near the closing price of the previous day but closed near the start of the previous day, a warning that the trend may change. On the final day, the price opened near the closing price of the second day and closed a little bit higher, however, bulls did try during the day to push the price higher but failed.
The pattern was completed on the third day. And, from there the price declined by making a gap down.
This pattern occurred after a long uptrend, which is another confirmation for the pattern.
The CCI Indicator also signaled an overbought condition. It is another support for the shooting star tweezers.
Because the above shooting star tweezers formed after an extended uptrend, and two long candles plus a doji could not move up further, it was a good opportunity.
Piercing and Dark Cloud Cover Tweezers
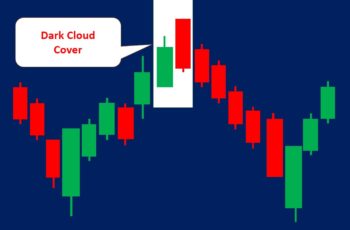
A piercing tweezers looks like a piercing pattern. And a tweezers with a dark cloud cover looks like a dark cloud cover pattern.
A piercing tweezers structure is a bullish pattern forming at the bottom of a trend. And a dark cloud cover structure is a bearish pattern that sets up at the top of a trend.
The difference between a piercing tweezers and a regular piercing pattern is the low prices of the candles that create the pattern. In a regular piercing pattern, the low prices are not must to be the same, however, in a piercing tweezers, it is.
The difference between a dark cloud cover tweezers and a regular dark cloud cover is the high prices of the candles that make the pattern. In a dark cloud cover tweezers, the high prices should be the same, and it is not a must in a regular dark cloud cover.
Piercing Tweezers Example
In the following chart, the Meta stock made a piercing tweezers that reversed the trend. And then, warned by another tweezers top, but started falling after a dark cloud cover. In this example, I only elaborate on the piercing tweezers.
The first candle of this piercing tweezers (early June) started after a gap down. It was scary. However, it stopped near a support area.
The above structure became successful because it formed near a support area, and the CCI showed an oversold condition.
When you face a tweezers like this, be careful. You need strong confirmation to take the risk. Probably, in the above chart, the best time to buy was two after the third candle. The two doji candles after the tweezers made weak the bears to try further pushing down the price.
And the stop loss should be placed under the tweezers. Because if a session closes under the tweezers, then the perspective changes.
Dark Cloud Cover Tweezers Example
The Pinterest stock completed a dark cloud cover tweezers on 22 August 2019.
Here is the chart.
In the above chart, the first candle of the dark cloud cover tweezers starts after a small gap-up, and it is a tall candle. And, the second start at the closing price of the first candle and closes near the beginning of the first.
The next session after the dark cloud cover tweezers opens after a tiny gap-down. However, it hesitates to fall further. Finally, a tall red candle fills both mentioned gaps, ensuring that the market reversed the direction.
There is one more strong technical signal that Pinterest stock is overbought near the dark cloud cover tweezers. It is the Commodity Channel Index (CCI). The CCI started convergence from the beginning of August and continued for a long time.
Finally, the convergence made by the CCI and the small gap-down were potent signals. In charts like this, shorting is an opportunity, and the stop loss should be put above the tweezers.
Bottom Line
Tweezers candlestick patterns contain two or more candles. In a tweezers top the high prices are the same, and in a tweezers bottom the lows.
Tweezers form less often than other reversal patterns. Thus, they need more confirmation.

