A spinning top is a single candlestick that has a small body. It can form anywhere in the chart. And traders often use it as a reversal pattern.
The color of a spinning top does not matter. It can be red or green. Moreover, it can have long or tiny shadows.
During a rally or fall, it is a sign of a trend’s weakness, warning of a possible reversal. And, after the change of direction, it is a sign of indecision that predicts nothing.
Generally, a spinning top says about the calmness in the market. What direction market will head? First, nobody knows when the market goes lateral. Second, the bears may take control of the market if it is in an overbought condition, and bulls will do it if it is in an oversold condition.
Side note: the spinning top name comes from the toy that has sharp point at the bottom, designed to spin. Anywhere that this candle appears, is a spinning top. So, we do not have a spinning bottom.
How to Trade Spinning Top Candlestick Patterns?
Because a spinning top is a single candlestick pattern and has a small body, it is not very reliable.
So, assure that confirmers are in the chart to place a new trade.
Some of the chart features that can confirm it are the followings:
- Longer shadows and smaller bodies lead to vulnerability of the current trend and increase reversal chance.
- Because of being a single candle pattern, wait for the next candles for confirmation. So, don’t sell immediately after formation.
- Other technical tools and charts can reject or confirm the spinning top’s prediction. Look for them.
- Fundamental data and the economic calendar explain a lot about the health of the trend. Use them to your advantage.
- If you found it reliable, do not forget to put a stop loss at the top (if formed at the top) or under the pattern (if appeared at the bottom).
Special care is needed when you find this pattern because it is not as reliable as engulfing and hammer patterns. Be aware of losing your capital.
Examples of Spinning Top Candlestick Patterns
In the following, I have brought you two examples. The first appeared at the top and the second at the bottom.
Example #1
In late November 2021, the S&P 500 made multiple spinning tops.
On the 28th of December 2021, a doji appeared after four green sessions, creating doubt about the bulls’ momentum.
Next, four spinning tops formed, which was followed by another doji. These spinning tops and doji could not break a resistance line that created themselves. And because they were going lateral, they could be continuation or reversal patterns. So, as mentioned earlier, traders should wait in these situations for the next candles to confirm a reversal or a continuation.
Finally, on the fifth of January 2022, a long bearish candle confirmed that doji and spinning tops were reversal signals.
Example #2
Check the following pattern.
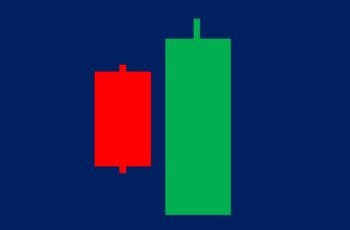
In the above chart, a spinning top candlestick (the first candle of the engulfing pattern) appeared at the end of a pullback.
As mentioned earlier, we need to wait for confirmation after the formation of a spinning top. And it paid off in the above chart. A real body green candle appeared and completed a bullish engulfing pattern, together with the red spinning top.
After the appearance of the bullish engulfing pattern, the risk has reduced. And, buying will carry less risk than without a confirmation.
Differences Between Spinning Tops and Doji
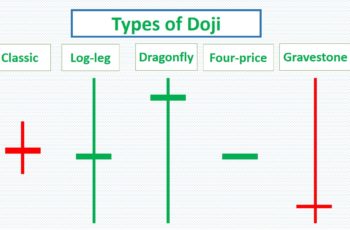
Both are single candlestick patterns. And both indicate indecision moments and possible reversal.
However, considering the length of shadows the same, doji are more potent.
Final Words
A spinning top candlestick can appear anywhere in the chart. It has a reversal implication if there are enough supporting signals.
This pattern is not as reliable as engulfing, harami, and counterattack candlestick patterns. So, trade with care.

