What is Dark Cloud Cover?
A dark cloud cover is a bearish reversal candlestick pattern that forms at the top of a trend. It also appears at the end of the bearish continuation pattern.
(In candlestick patterns, we consider a correction as a trend)
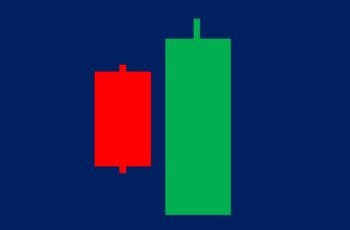
This Pattern has two candlesticks. And both of them have large bodies. The first one is bullish, and the second is a bearish candlestick.
The second candle opens after a gap but fails to maintain and closes within the price range of the first candle. In a perfect dark cloud cover, the second (red) candle closes lower than the middle of the first (green) candle.
Combining both candlesticks in this pattern gives us a Shooting Start Candlestick Pattern. For example, combining an hourly-chart dark cloud cover pattern gives us a two-hour chart of a green shooting star. It is a reversal bearish structure as well.
The opposite of dark cloud cover is the piercing pattern that appears at the end of a downtrend. Moreover, a piercing pattern requires taller candles (volume) to reverse the direction.
How to Trade Dark Cloud Cover?
Dark cloud cover is among the most well-known reversal patterns. Thus, it is essential to know its features.
Here are some features a trader or investor should consider while discovering this structure:
- There should be an uptrend before dark cloud cover. This trend is acceptable even if short in time, for example, a correction pattern.
- Taller candles in the structure make it more reliable.
- The more the second candle (red) penetrates the first candle (green), the higher the chance of reversal.
- Smaller shadows or no shadows increase its reliability. It means that the bear side of the market player is in control.
- Look for other chart and candlestick patterns before this pattern. They can show if the trend before these patterns is weakening or not. For example, look if a support or resistance line exists or not.
- Use a technical indicator such as MACD and Bollinger Bands. These indicators show the overbought and oversold conditions by diverging and converging.
- Always blend your technical analysis with fundamental analysis. Technical and fundamental analysis can confirm or reject each other. Confirmation is a good, and rejection is a bad signal.
More confirmation adds to the reliability. It means it is better to avoid selling if only this pattern exists without supporting signals.
The number of validators depends on where it appears. Sometimes one or two signal is enough.
Examples of Dark Cloud Cover
I have brought you two examples.
The first example is from PayPal and the second is from eBay charts.
I also gathered and provided possible forces that made those patterns.
First Example
On the fourth and fifth of April, PayPal stock made a dark cloud cover pattern. It predicted a downtrend correctly, shown in the following chart.
Looking at the chart, here are some of the reasons that helped PayPal stock to fall:
- A bearish engulfing pattern formed after a bullish gap. Since it appeared after a gap, it was not a reliable bearish reversal pattern. However, it was a signal that bulls are losing control.
- The price chart was making higher highs, but the MACD indicator was rejecting them. It is another sign of bulls’ weakness.
- Third, due to a bullish gap before the bearish engulfing pattern, it needed more confirmation. And, it was guaranteed after a bearish gap that occurred after the dark cloud cover. If you were not convinced, the bearish gap should have convinced you.
- On the fifth of April, there was news reporting that PayPal has introduced a “cashback credit card” program. PayPal decided to pay 3% cash back on all purchases made by its card. Investors didn’t like it and bears took control of the trend.
Second Example
In the middle of October, eBay stock created a dark cloud cover. After this pattern, the stock fell around 20%, from 56 to 46 before resuming another uptrend.
The above pattern did not touch the previous resistance line. But, it predicted a top.
The following are some of the reasons that can be on the chart that made this pattern succeed in predicting a downtrend:
- The above piercing pattern appeared near a resistance line, or in a resistance area. It is a sign of caution.
- Both candles are tall. The size of candles in a piercing pattern matters. Taller is better.
- The most important signal is a gap down after the piercing pattern. Gaps (windows) are the most potent structures among candlestick patterns.
The above piecing pattern did not have too many signals. However, the gap down is so strong that makes me consider its power more than many signals.
Dark Cloud Cover vs Bearish Engulfing Pattern
Both of these patterns are reversal candlestick structures.
When the second candle in the dark cloud cover closes below the opening price of the first candle, it becomes a bearish engulfing pattern.
Technically, a bearish engulfing pattern is more reliable because it closes lower. And closing lower means more bearish.
Bottom Line
The dark cloud cover, the counterpart of the piercing pattern, is a reversal structure.
Because it reversal pattern, confirmers are necessary that can be technical and fundamental.

