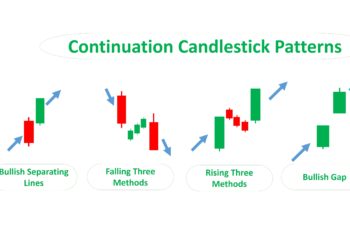
Falling three methods is a bullish continuation candlestick pattern.
This pattern has four or more candles. The first candle is a long red candle followed by two or more candles that go lateral or rise in a shallow steep. And the final candle, like the first candle, is long and red.
By definition, the number of candles between the first and last is three. However, it is OK if they are two or more candles, such as four or five, as long as they stay within the range of the first and last candles.
The “falling three methods” says that in a fierce fight, bears defeated the bulls, creating the first red candle. After resting a few sessions, the bears continued putting down bulls to continue going downward.
The “falling three methods” is similar to the bearish flag pattern. However, it is not necessary for a bearish flag pattern for the first and last candle to be tall and red.
The counterpart of this pattern is the rising three methods, which is a bullish continuation pattern. But the trading strategy is somehow different.
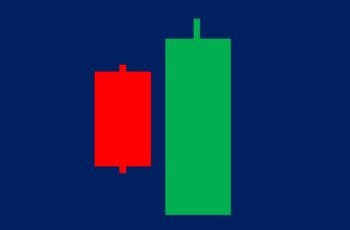
Here is an image showing both of them together.
How to Trade Falling Three Methods?
A falling three methods complete its shape in four or more sessions. So, patience is required.
Because it is a bearish continuation pattern, assure that a downtrend (specifically in the stock market) exists.
If you find a falling three methods, consider the following seven factors in your analysis.
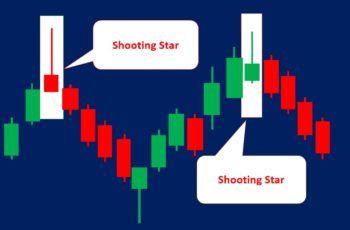
- There should be a clear downtrend, especially in the stock market. Or, it should follow a strong reversal bearish pattern, such as a shooting star.
- Tall first and last red candles translate to more reliability.
- Smaller candles in between mean a high-quality rest. Thus, more reliable.
- The candles between the first and last candles that go sideways produce a more reliable falling three methods.
- Always validate your analysis with other technical tools, such as leading indicators and patterns.
- Check out the economic calendar and news, and other fundamental data.
- Finally, if you are satisfied, sell and put a stop loss at the top of the pattern. If you have an open short position, move your stop-loss to the top of this pattern.
You do not need to have all of the above seven signals to trade. As long as there are enough pieces of evidence, it is a chance of selling.
Examples of Falling Three Methods
In this post, I show you three examples from the Meta stock, EURUSD and Alibaba Group.
Example #1
On the 24 of September, the Meta stock completed a falling three methods candlestick pattern.
This pattern has some signals confirming it as a good bearish structure.
This pattern took shape after a classic head and shoulders pattern. Actually, the first red candle broke the support line of the head and shoulder. It is also completed in a clear downtrend and the size outer candles are tall enough. All of these are supporting signals for a bearish pattern.
The above pattern did not broker a support line created from 16 to 18 September. However, the next two candles broke and confirmed the pattern. This is another confirmation.
Finally, if you sell in similar situations, put a stop-loss above the last candle.
Example #2
The EURUSD made a falling three methods in the daily chart of January 2020. Although candles between the first and last candles were not stable but succeeded in dragging down the price.
The “head and shoulders” pattern, which is completed by the end of the falling three methods is the first confirmation.
Moreover, the candle that precedes the last candle of the pattern is a shooting star. A shooting star itself is a bearish reversal pattern, which is one more confirmation of the above pattern.
From a risk/reward perspective, the candles between the first and last candles of the falling three methods pose a risk because they are not small enough and have shadows. Due to this risk, never forget to put a stop-loss at the top of the pattern.
Example #3
In the following chart, the Alibaba Group made three “falling three methods” candlestick patterns.
The first falling three methods pattern appeared after a gap-down. It is one of the most powerful signals because gaps are among the most powerful support and resistance areas.
Before the second pattern, the candles were going sideways. And it took shape when the market was not falling into a convincing phase. Technically, it formed when the market was not trending well. However, the price continued to fall. It happens. Sometimes there is no good signal but the price goes up or down.
Finally, the third pattern formed after a huge gap-down, which is a potent supporting signal. Additionally, the last candle of this pattern is a tall red candle, which is another good signal.
Based on the above arguments, the first and last “falling three methods patterns” were opportunities to sell.
Final Words
The “falling three methods” is a bearish continuation candlestick pattern, which is the opposite of the rising three methods.
Trading continuation patterns is easier than reversal patterns because fewer supporting signal is sufficient to continue its direction. And, it is more likely for the price to continue its current direction than to reverse.

