A broadening wedge pattern is a price chart formations that widen as they develop. In other words, in a broadening wedge pattern, support and resistance lines diverge as the structure matures.
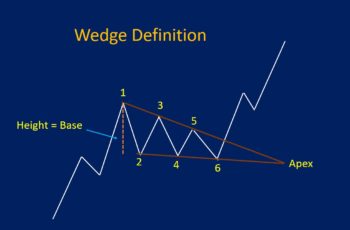
If we compare broadening wedges, they are the flip side of regular wedges. In a regular wedge, the upper and lower lines of the formation converge, while in the broadening version, they diverge.
They are ascending and descending wedge patterns. And this article discusses them separately.
Ascending Broadening Wedge Pattern
An ascending broadening wedge pattern begins narrower and ends wider while its support and resistance lines rise. As it continues development, its trendlines diverge, and at the same time, both are rising.
An ascending broadening wedge pattern is a bearish continuation chart structure. And it appears in a downtrend.
Notice that this pattern completes when the price drop below its support line.
This structure can be tall or short at the end. If the pattern’s height is short you can sell after breaking the support line and put your stop-loss above the resistance line, and your take-profit should be at the starting level. On the other hand, if its height is tall, you can trade inside the pattern near the top or wait for a correction and put your stop-loss and take-profit levels based on smaller structures.
Example
The 4-hourly chart of the GBPUSD pair made an ascending broadening wedge from mid-July to mid-August.
On 15 August the price broke the support line of the pattern. After a pullback, it continued falling by making a bearish rectangle and a rising wedge pattern.
Descending Broadening Wedge Pattern
A descending broadening wedge pattern is the mirror image of the ascending broadening wedge.
Trendlines in this pattern diverge, and at the same time, they fall as the structure completes.
A descending broadening wedge is a bullish continuation formation and appears in the middle of an uptrend. And this pattern completes when the price breaks the resistance line.
Like the ascending broadening wedge, this structure can be tall or short. Place your order above the resistance line, and trade inside if the pattern is tall. Treat your take-profit and stop-loss orders the same as the ascending pattern.
Examples
The weekly gold price chart made a descending broadening wedge formation that was completed in early 2009.
The price broke the resistance line of the formation at the $900 price level. Then, it continued rising by making bullish continuation patterns such as ABCD patterns.
Here is a price chart made of both ascending and descending broadening wedge patterns. Moreover, you also see a regular wedge.

