Srading.com

Menu
  • Home
  • Markets
    • Forex
    • Stock
  • Fundamental Analysis
    • Economics
    • Money & Banking
  • Technical Analysis
    • Drawing Tools
    • Chart Patterns
  • Tools
    • Online Charts
    • Economic Calendar
    • Interest Rate Today (Live Widget)
    • Forex Market Hours
    • Currency Indexes Chart
    • National Holiday Calendar
    • CoT Chart
    • Quotes
Home
Technical Analysis
Chart Patterns
Chart Patterns: Types and How to Trade Them?
Chart Patterns

Chart Patterns: Types and How to Trade Them?

July 3, 2022 Zafari

You Will Continue Reading

Toggle
  • What Are Chart Patterns?
  • Types of Chart Patterns
    • Reversal and Correction Patterns
    • A Correction Pattern Is Either Bullish or Bearish
      • Bullish Patterns
      • Bearish Patterns
  • How to Trade a Chart Pattern?
  • Summary

What Are Chart Patterns?

Chart patterns or structures are shapes that appear in the chart by market price action. They help traders to predict the next possible direction or trend. 

A chart pattern forms with a combination of several big or tiny ups and downs. 

Chart patterns or structures occur on every chart in the financial market such as forex, stock, cryptos, etc. Thus, every trader needs to learn them and practice them.

Notice that in this article we are not talking about candlestick patterns here, although they are on charts. Candlestick patterns are a combination of one or a few candles, while chart patterns are a combination of small upward and downward movements. Additionally, we do not cover everything about chart patterns in this article, because it will be too long, maybe 100k words or more. This article is just an introduction

Patterns or structures are the primary tools of technical analysis that predict possible price actions in the future.  

Chart patterns are essential in any technical analysis techniques, including Elliott Wave analysis and Support and Resistance Lines analysis. So, you must learn and experience chart pattern formations.

Fundamental analysts also use chart patterns because speculators always speculate in the market, and fundamental analysts cannot predict speculators’ actions. Thus, they need to learn technical analysis and chart patterns as well.

Structures or patterns form due to common human trading behaviors. People get used to behaving in a certain way, and these behaviors produce chart patterns.

For example, traders react to a news announcement by buying or selling an underlying financial asset. The reaction of all participants in the market pulls down and pushes up the asset price forming a structure. If the price broke this structure upward, bulls are stronger, and if it broke downward, bears are stronger.

Numerous patterns appear on the chart. And not all of them are reliable. A pattern to be reliable should repeat itself over and over again.

It is crucial to learn and experience trading chart patterns because most of the time a market is not trending. It is consolidating.

Read more: Fundamental Analysis of Stocks

Types of Chart Patterns

Generally, there are two categories of patterns: (1) reversal and correction patterns, and (2) bullish and bearish chart patterns. In many places, a pattern can be a reversal, correction, and bullish/bearish at the same time.

Read more: What is a Trend in Finance? How to Determine a Trend?

Reversal and Correction Patterns

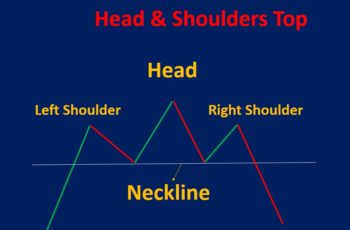
A reversal pattern appears when a trend is over. It tells you that the market direction is possibly going to reverse. If a reversal pattern forms at the top of a trend, it suggests a future downtrend. On the other hand, if a reversal chart pattern appears at the bottom of a chart, it suggests a future uptrend.

The double top and double bottom reversal patterns are examples of reversal patterns. A double top occurs a the top of a trend and double bottom at the bottom of a trend.

Double top and double bottom chart patterns

A correction pattern appears in a bigger trend. It suggests that the trend is going to continue. Correction pattern is also called continuation pattern and consolidation pattern. Because most of the time a financial asset price is making corrections, you need to identify them.

A Correction Pattern Is Either Bullish or Bearish

A bullish pattern is a structure that suggests a future uptrend or continuation of an uptrend. On the other hand, a bearish pattern suggests a future downtrend or a continuation of a downtrend.

Most of the bullish and bearish patterns are correction structures. A correction pattern can either be bullish or bearish.

Bullish Patterns

A bullish pattern that occurs in an uptrend, suggests that the current direction will continue.

Examples of bullish patterns that occur in an uptrend are flag and wedge bullish patterns. These patterns predict the continuation of the direction upward. And, bullish patterns at the bottom (it is also called reversal pattern at the bottom) of the chart also form but, they are less strong compared to bullish patterns in an uptrend.

Bullish flag and bullish wedge

Bearish Patterns

A bearish pattern that occurs in a downtrend suggests the continuation of the downtrend movement price. In addition, a bearish pattern can occur at the top of a trend and suggest a future downtrend. Bearish patterns at the top are also called reversal pattern.

Examples of bearish patterns that occur in a downtrend are bearish flags and wedge patterns. They suggest the market will continue falling. After breaking down the pattern, it is confirmed and completed.

Bearish flag and wedge chart patterns

Read more: What Are Bull and Bear Markets? (Plus Examples)

How to Trade a Chart Pattern?

Every chart pattern is different, and different rules apply to them. This article only illustrates the most essential things a trader should remember for trading a chart pattern.

To begin trading a pattern, you need to identify and draw it correctly.

Identification of a pattern requires knowledge and practice. Play with charts and try to find as many patterns as possible. It helps your mind to recognize upcoming patterns easier, and more of them.

A chart pattern is temporary. The price breaks the pattern and later starts making another chart pattern. Once the price breaks the pattern, depending on the direction of the breakout, it is time to sell or buy the underlying asset. And maybe close your position if you have an open one.

The most important action for a trader is to not place a trade before a breakout of the chart. If you place a trade before the price breaks the pattern, the risk will increase, because no one knows in what direction the price will break the structure.

Wait for chart patterns to breakout

Additionally, it is essential to put a stop loss in the correct place and don’t move before another structure is completed.

Read more: Support and Resistance Lines (How to Trade and Example)

Summary

A pattern is a structure or shape that several candlesticks or a graph make on the chart. And, it predicts possible future price movements.

Patterns that suggest the end of a trend and the start of a new trend are called reversal chart patterns. A pattern that corrects market price is a correction pattern.

Patterns that suggest the continuation of an uptrend or a future uptrend, are bullish. On the other hand, those that predict the continuation of a downtrend or a future downtrend, are bearish patterns.

A trader first should identify a pattern and after the breakout of the pattern and confirmation should place his trade.

Share
Tweet
Linkedin
Pinterest
Reddit
Email
Next Article
Tags:Forex Pattern Stocks Technical Analysis

Related Articles

V-Shaped Patterns: How to Trade, and Examples

V-Shaped Patterns: How to Trade, and Examples

Rounding Bottom Pattern: Trading Strategy and Examples

Rounding Bottom Pattern: Trading Strategy and Examples

Hammer Candlestick Patterns (Types, Strategies & Examples)

Hammer Candlestick Patterns (Types, Strategies & Examples)

Diamond Chart Pattern Explained [Example Included]

Diamond Chart Pattern Explained [Example Included]

Wedge Pattern: Rising & Falling Wedges, Plus Examples

Wedge Pattern: Rising & Falling Wedges, Plus Examples

Rectangle Pattern: Types, Trading Strategy, Features & Examples

Rectangle Pattern: Types, Trading Strategy, Features & Examples

About The Author

Zafari

Zafari is a professional trader and has been in the financial market since 2014. He has a bachelor of public economics and an MBA. For some reason, he does not show his face. And he loves you all!

Leave a Reply Cancel Reply

Recent Posts

  • Capitalism: The Definitive Guide
    What Is Capitalism? Capitalism is an economic and political system …
  • Trading Checklist: What It Is, Info-graphic, and …
    What Is a Trading Checklist? A trading checklist is a …
  • Private Equity (PE): What It Is, How …
    Private equity is an investment in a private company. The …
  • Government Spending: The Definitive Guide
    Government spending refers to the government’s total expense and the …
  • Three Basic Economic Questions Explained in Simple …
    Three basic economic questions are: Who answers these questions? The …

Popular Posts

    Srading.com

    QUICK LINKS

    • About
    • Cookies Policy
    • Terms & Conditions
    • Disclaimer
    • Privacy Policy
    • Contact Us

    LATEST POSTS

    • Capitalism: The Definitive Guide
    • Trading Checklist: What It Is, Info-graphic, and PDF
    • Private Equity (PE): What It Is, How It Works, & How to Get In
    • Government Spending: The Definitive Guide
    • Three Basic Economic Questions Explained in Simple Words

    FOLLOW US ON SOCIAL MEDIA

    • Facebook
    • Twitter
    • LinkedIn
    • Instagram
    • Pinterest
    • Telegram
    • Reddit
    • YouTube

    Trading financial assets are risky. Everything you read on this website is just for educational purposes or personal opinions only. Read our DISCLAIMER!

    Copyright © 2025 Srading.com
    Call on WhatsApp

    Ad Blocker Detected

    Our website is made possible by displaying online advertisements to our visitors. Please consider supporting us by disabling your ad blocker.

    Refresh
    We use cookies on our website to give you the most relevant experience by remembering your preferences and repeat visits. By continuing this website or clicking “Accept”, you consent to the use of ALL the cookies.
    Do not sell my personal information.
    Cookie SettingsAccept
    Cookies Policy
    Manage consent

    Privacy Overview

    This website uses cookies to improve your experience while you navigate through the website. Out of these, the cookies that are categorized as necessary are stored on your browser as they are essential for the working of basic functionalities of the website. We also use third-party cookies that help us analyze and understand how you use this website. These cookies will be stored in your browser only with your consent. You also have the option to opt-out of these cookies. But opting out of some of these cookies may affect your browsing experience.
    Necessary
    Always Enabled
    Necessary cookies are absolutely essential for the website to function properly. These cookies ensure basic functionalities and security features of the website, anonymously.
    CookieDurationDescription
    cookielawinfo-checkbox-analytics11 monthsThis cookie is set by GDPR Cookie Consent plugin. The cookie is used to store the user consent for the cookies in the category "Analytics".
    cookielawinfo-checkbox-functional11 monthsThe cookie is set by GDPR cookie consent to record the user consent for the cookies in the category "Functional".
    cookielawinfo-checkbox-necessary11 monthsThis cookie is set by GDPR Cookie Consent plugin. The cookies is used to store the user consent for the cookies in the category "Necessary".
    cookielawinfo-checkbox-others11 monthsThis cookie is set by GDPR Cookie Consent plugin. The cookie is used to store the user consent for the cookies in the category "Other.
    cookielawinfo-checkbox-performance11 monthsThis cookie is set by GDPR Cookie Consent plugin. The cookie is used to store the user consent for the cookies in the category "Performance".
    viewed_cookie_policy11 monthsThe cookie is set by the GDPR Cookie Consent plugin and is used to store whether or not user has consented to the use of cookies. It does not store any personal data.
    Functional
    Functional cookies help to perform certain functionalities like sharing the content of the website on social media platforms, collect feedbacks, and other third-party features.
    Performance
    Performance cookies are used to understand and analyze the key performance indexes of the website which helps in delivering a better user experience for the visitors.
    Analytics
    Analytical cookies are used to understand how visitors interact with the website. These cookies help provide information on metrics the number of visitors, bounce rate, traffic source, etc.
    Advertisement
    Advertisement cookies are used to provide visitors with relevant ads and marketing campaigns. These cookies track visitors across websites and collect information to provide customized ads.
    Others
    Other uncategorized cookies are those that are being analyzed and have not been classified into a category as yet.
    SAVE & ACCEPT