This article is a guide on how to use MetaTrader 4, also known as MT4. It begins with downloading MT4 and finishes with a short introduction to Expert Advisor.
This article is a guide and does not cover those topics that need in-depth explanation. We have a separate article or will write in the future covering essential tools and subjects in MetaTrader 4.
What Is the MetaTrader 4?
MetaTrader 4 is the most popular electronic trading platform for trading Forex, CFDs, and analysis of charts using Expert Advisors.
MT4 is free for traders. However, MetaQoutes, a Software Company based in Cyprus, developed and released MT4 in 2005, charges brokers upfront plus services, hosting, bridging, support, and other fees. And your broker makes money by charging you spreads and commissions when trading Currency Pairs and CFDs.
MetaTrader 4 has a built-in market where you can buy Expert Advisors (trading robots) and signals from sellers and providers. An Expert Advisor is a software installed in MT4 that trades on your behalf based on your instructions. And Signals are for new traders to to copy successful traders.
MT4 is available for all computer operating systems: Mac, Windows, and Linux. Additionally, it has mobile apps for iPhone, Android, and Huawei phones, enabling you to trade on the walk.
MT4 Download and Installation
Downloading MT4 is free. You can download it from any broker’s website.
In this article, we download from ifcmarkets.com, a broker that supports trading 650+ instruments with 17+ years of experience.
First, go to downloading page and download. My computer’s OS is Windows, so I choose Windows and click on Download MetaTrader 4.
From the download folder, find the downloaded file and complete the installation. And click on Finish to start working with MetaTrader 4.
Opening an MT4 Account
As you click on Finish, a window pops up (look at the below image). It lists all available servers. In the following image, you see two servers, one for demo and one for real accounts.
Demo accounts are virtual, which allows you to test the broker’s services, or test your strategies that mimic the real account. And real accounts are those accounts that you have deposited real money for trading financial assets.
For this article, we select the demo account and click on next.
To start working, you should open a new account or log in to an existing account.
If you have an account, select the first option and enter your login ID and password. If you don’t have one, create a new demo or real account.
Because we start from the beginning, we create a new demo account. So, we select “New demo account” and click on Next.
If you open a new real account, it will take you to your broker’s address to fill out a form. Because we open a demo account, a new window opens without taking us somewhere else.
The following form shows the required information to open a demo account.
Put your name, email, and phone number.
Some brokers provide various types of accounts, such as standard, mini, and Islamic accounts. Choose what suits you. We chose the default type, in which the base currency is the USD.
The deposit amount is to select the amount of money you want to start trading with. We chose $5000.
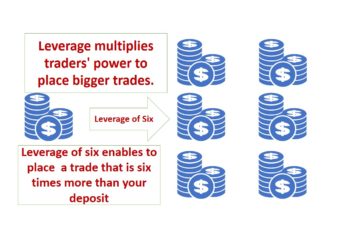
Leverage is the amount of money that you can borrow from your broker. It is expressed in ratio. We selected the 1:50. It means we can trade up to 50 times more than our balance deposit, which was $5000. From the mathematical point, we place a trade/s up to $250000 (50*5000=250000).
When you finished, check “I agree to subscribe to your newsletters” and click Next.
Customizing MetaTrader 4 Chart
Now you are ready to practice. The MetaTrader 4 welcomes you by completing your account opening (see the following chart).
We closed all charts, except the Gold (XAUUSD) to customize our chart. Later we can add them.
To make your chart beautiful, right-click on the main chart and select properties.
The properties window has two tabs, colors and common.
The following image shows what I like my chart to look like. Change properties the way that like, and click on OK to finish setting.
All the above parameters are self-explanatory. I think the best way to understand them is to play with them.
The following image shows what the chart looks like when I clicked OK.
If you want to apply the current chart settings on other charts, save it as a template.
To save as a template, right-click on the chart, go to the template, and click save template. Then give it a name and click on save.
To apply your template settings on other charts, right-click on the chart and select your template.
The following image compares before and after applying the Forex template we just saved.
MetaTrader 4 User Interface
MetaTrader 4 user interface is simple.
First, look at the following image.
Here I explain them in bullet points. And later each will be explained in detail.
- Title Bar: The Title Bar shows information about your broker, account, and the open chart.
- Menu Bar: The Menu Bar consists of File, View, Insert, Charts, Tools, Window, and Help tabs. They contain all settings and tools. We will introduce them one by one. So, continue reading.
- Toolbar: The Toolbar contains Standard, Line Studies, and Time-frame sub-toolbars. These sub-toolbars can be customized based on the user’s preference for easy access. Traders add tools that use most frequently.
- Status Bar: Status Bar is at the bottom of the chart. It shows Open, High, Low, and Closing prices (OHLC), profile (explained later), volume, and the internet connection status at the end of the bar.
- Charts Bar: The Charts Bar shows the list of symbols that have open charts. You can sort, add or close the one you do not need.
- Trade Panel: In the trade panel, you see the sell-side, buy-side, and volume number in the middle of the upper side.
- Main Chart: The main chart is in the center of the window containing a price chart in the center, horizontal axes of time, vertical axes of price, and a trade panel on the upper left side of the window.
Menu Bar in MetaTrader 4
Menu Bar contains File, View, Insert, Tools, Window, and Help tabs. Everything in the MT4 is available in the Menu Bar. However, its access is not as easy as other methods. That is why other tools and windows are there.
This article explains, in brief, the constituents of the Menu Bar, and for those options/tabs that need more clarification, we have a separate article for them or will write.
Let us start with File tab.
File Menu in MT4
The file tab includes options related to opening and closing accounts and charts.
Look at the following image.
And let us explain them.
- New Chart: The New Chart allows you to add a new symbol to your opened charts. And I will discuss it in more detail in the Standard Toolbar subtitle later in this article.
- Open Offline: lets you access downloaded data of symbols, which can be data from a third party or downloaded from your broker.
- Open Deleted: The recently deleted charts will be listed here, and you can undo the deletion.
- Profile: A profile is used to group symbols related to each other which helps analysis. For example, you can add a new profile containing only commodities. To add a new profile, you have to open the “Default” profile shown on the list of profiles. Add your favorite symbols, apply your favorite template, name and save them.
- Close: This option closes the chart of the opened symbol.
- Save As: You can save it as an Excel file: the date, opening, close, high and low prices, and also the volume of the opened symbol.
- Save as Picture: You can save your chart and distribute it as you mention the copyright at the bottom of shared images. You have three options to save it, and they are: (1) Save active workspace: it will save the chart completely, including the title bar at the top and the status bar at the bottom. (2) Save Chart (as is): if choosing this option, you will save the chart as a picture excluding all bars and trade panels. (3) Active Chart: This option allows you to select the size of the saved picture. You can also share it with the MQL community if you wish.
- Open Data Folder: This option allows you to Open Data Folder on your computer, where it is saved on your computer. You need to find this folder when you want to install purchased Expert Advisors, and indicators, and if you want to read the source code of these tools. To install an indicator, an Expert Advisor, or something else, simply paste it into the relevant folder and restart your platform.
- Print: To print on paper, you need this option.
- Print Preview: This option is to see how it would look like if you print it.
- Print Setup: Some settings allow you to print in the size that you want and if you want it in portrait or landscape.
- Open an Account: If you have not opened an account, then here is an option to open a demo account or a real account. It is the same as explained earlier.
- Deposit: This option directs you to the website of your broker to deposit funds into your account.
- Withdrawal: This option directs you to the website of your broker to withdraw the profit that you made.
- Login to Trade Account: If you want to log in to your account, or you have not yet logged in, this is the option to do so.
- Log in to Web Trader: This option directs you to the version of the web platform of MetaTrader.
- Login to MQL5.community: This is a community for discussion and finding answers to your unanswered questions.
- Exit: This option is to close your trading platform.
View Menu in MT4
The view tab is to set what tools you want to see or hide them. It is all about quick access if you want to have some elements or not.
Language is the first option. It allows you to set the language of the software itself. Choose the language from the list. Please remember that the software is not entirely translated into the languages listed in the language option. For example, you still will see the symbol in English if you choose Persian as the language of your platform.
Look at the following image. It is messy but helpful and introduces all elements of the view tab. Later, this article explains the usage of all the below elements.
Insert Menu
The Insert tab contains all tools a trader may want to put on the chart. These tools help to analyze charts to predict future movement.
Each tool in the Insert tab except Shapes, Arrows, and Text needs a separate article. Srading.com has already articles about some of them and will add more in the future. So, this article does cover all of them.
As a trader, you do not need to experience and know about all of them because you may not need them. If you add too many tools to your chart, they even may look your chart looks bad and messy and make analysis more difficult. Remember that a clean chart is better than a messy one.
Indicators in the MetaTrader 4
A technical indicator is built-in financial software that helps to predict the price change relative to time by the indicator graph movement itself.
The following image shows how we inserted the MACD indicator, appearing in the indicator window under the main chart.
Explaining all indicators and giving their example usage is impossible in this article. If you like to read about them, here are some articles covering a few of them:
- MACD Indicator: Calculation & How to Trade It?
- All Moving Averages (SMA, EMA, SMMA, and LWMA)
- Momentum Indicator: Calculation and How to Trade
- What is the Stochastics Oscillator & How to Trade It?
- Commodity Channel Index (CCI): Calculation and Trading Strategy
- Relative Strength Index (RSI): Calculation & How to Trade It?
Lines in MT4
Traders use horizontal lines to draw support and resistance lines/areas and the Trendline to define uptrends and downtrends.
In the above chart, for example, we drew a short resistance and a short support line using the Trendline.
Gann in MT4
Traders use Gann indicators developed by W.D. Gann in predicting support and resistance lines, peaks, bottoms, and future price moves.
Still nowadays, some day traders use Gann techniques, but we do not. These tools could be helpful. However, they did not work for us. So, we may not write about them.
Fibonacci in MT4
Fibonacci (Fibo) tools are made of Fibo numbers and ratios. They are used to define future support and resistance lines.
The Fibo Retracement is used how much the price will retrace (pullback) before continuing in the current direction. And the Fibo Expansion how much the price will extend to the current direction.
Fibo Fan, Arcs, and Time all are used to predict support and resistance areas.
We have an article introducing the Fibonacci completely: What are Fibonacci Numbers, Golden Ratios, and Tools
Andrews’ Pitchfork Channel in MT4
The Andrews’ Pitchfork uses three trendlines to identify trends and support and resistance lines. The higher line indicates the support line and the lower line indicates the resistance line.
Andrews’ Pitchfork has for controlling points. Points 1, 2, and three are used to apply it on your chart, and the fourth point which is the second point on the middle line, is to change the position of the channel entirely.
To draw an Andrews’ Pitchfork, place the first point (start of the middle line) at the start of a new trend, the second point at the new high in an uptrend, and at the new low in a downtrend. Finally, place the third point at the end of the pullback.
Cycle Lines in MetaTrader 4
The “cycle lines” is a tool to draw a row of vertical lines with equal intervals. Some traders use it to predict market cycles.
To draw, select a critical time on the chart and then drag and place it on the second critical point. The distance between two vertical lines is a cycle. And the next lines may predict the end and the beginning of future cycles.
Shapes, Arrows, and Text in MT4
Traders use shapes, arrows, and text in MT4 to label critical points on their charts. They are helpful to remember or put as a guide for future reference.
Charts Menu in MT4
The “Charts tab” allows you to set how your chart should look like.
We introduce all of its elements in the coming, under toolbars. Among them, we already set a template earlier in this article. And the indicator list and object list are shown in the following image, which does not need an explanation.
Tools Menu
The tools menu contains advanced settings. They are about testing EAs, and Signals for example that need separate articles. So, here, I just introduce their very basics.
- New Order: You can place a new order from here too.
- History Center: often used by expert advisor testers to download, add, edit, export, and import historical data. Moreover, downloading historical data helps to study the past quicker because they are readily available.
- Global Variables: used by Expert Advisor testers to run multiple EAs at the same time.
- MetaQuotes Language Editor: opens the MetaEditor of expert advisors, enabling you to create and edit robots, indicators, and scripts.
- Options: It opens the client terminal setting window, enabling a trader to set up parameters for connection, trades, charts, experts, and others. The options window settings are advanced topics. And it is advised to not change unless you understand them. I will cover them in other articles which are about Expert Advisors and Signal trading.
Toolbars In MetaTrader 4
Toolbars are the most used part of the MT4. They help us to have easy access to commands (Toolbar elements are called commands). And some of these are the most used commands such as terminal and timeframes.
There are four toolbars in the MetaTrader 4 under the menu bar. They are Standard, Line Studies, Charts, and Timeframes. You can change their location by dragging and dropping them to sort as you wish. Just left-click on the left side (on dashes) and hold and put where you want.
If you wish to not see a toolbar, go to View Tab, Toolbars, and uncheck that.
In the following, this article explains each of them in more detail but not completely, because some need separate articles.
Standard Toolbar in MetaTrader 4
The Standard Toolbar is about placing trades, editing tools (for developers), and printing.
If you don’t want the Standard Toolbar to appear, uncheck it by going to View>>Toolbars>>Standard, and if you want it to see, check it.
A toolbar is customizable too. To customize, Right-click on the toolbar and select Customize.
The window that opens has two lists: the right side shows inserted commands, and the left side shows those that you can insert.
In addition to inserting and removing commands, you can sort them by selecting them and then hitting the up or down button. Finally, if you want the default setting, hit the reset button.
Now, let us explain those commands.
New Chart
The New Chart allows you to open the chart of a new financial asset, such as currency pairs or sock CFDs.
To open a new chart from the Standard Toolbar, left-click on the first command from the left (shown inside a square) and select from available symbols.
Moreover, you can open a new chart from the File tab of the Menu Bar and Market Watch window as well.
Initially, a default template will apply. You can apply the template that we discussed earlier in this article.
After opening a new chart, its symbol appears in the charts bar at the bottom of the main chart, allowing you to change its position or apply settings.
Profile
A profile is a group of related financial assets for helping to check them at once.
For example, you may want to group all USD pairs or American indices and save them as a profile. Later, you can open the profile and see all of them together. It helps you to grasp the overall USD or American stock market condition.
Profiles help you to analyze currency correlations and sometimes even for Intermarket analysis. Currency correlation discusses how one currency is related to another. And Intermarket analysis examines the relationship between markets.
You can locate Profiles from the File>>Profiles or left-click on the Profiles icon on the Standard Toolbar. The first and second option is for going forward and backward between profiles, which saves you time. The third and fourth options are for saving and removing a profile.
To make a profile in the MT4, you need to do the followings:
- Open all related charts;
- Apply your template;
- Arrange windows; and
- Go to the profile command and save it.
Moreover, you can remove a template from your list if you want. To remove, go to Profiles>>Remove Profile and select the one you want to remove.
The following images show profiles locations and the American Indices profile that I made.
Market Watch
Market Watch in the MetaTrader facilitates watching markets at a glance. Unlike the main chart that shows price changes in a graph, the market watch does it in a table.
You can open the market watch either by going to View and clicking Market Watch or clicking on its icon in the Standard Toolbar.
The Market Watch contains a series of columns. The Symbol, Bid, and Ask columns is there by default, and you can not delete them. The first column is the symbols of currency pairs and symbols of CFDs. The second column shows the Bid Price (the price you accept when you sell). And the third column indicates the Ask Price (the price you pay when you buy).
You can add and remove other columns by right-clicking on Market Watch and checking and unchecking them.
By right-clicking on Market Watch some parameters appear (look at the above image), and they are:
- New Order: opens a new order window;
- Chart Window: opens a new chart of the selected symbols;
- Tick Chart: opens a window that shows price changes on a smaller scale. The red line indicates the Ask Price and the blue line is the bid price. By right-clicking on Tick Chart you can open the order window and a new chart too. Moreover, you can check the ask line and show or remove the grid;
- Depth of Market: shows the currency market price of the selected asset/pairs and enables easy order management. The center horizontal represents the current market price, the blue ^ above the center line enables buy stop order, and below the center line buy limit. On the other hand, the red ^ above the center line enables the sell limit, and below the center line sell stop. At the bottom of the window, you can set the stop loss and take profit orders in points (not pips) and the trade volume. The sell and buy button enables one to buy at the best market prices, and the close bottom closes the current open position.
- Specification: specifies symbol contract specification terms of a symbol trading set by the broker. Since there are too many parameters, I have included the specification of order in the Types of Forex Orders: Fully Explained article. And you can read it there.
- Hide: let you hide the selected symbol. Get help from below images;
- Hide All: hides all symbols, except those that have open charts that you can see in the charts bar;
- Show All: click to show all symbols;
- Symbols: add a specific symbol/pair you are looking for from the list. It works the opposite of the Hide;
- Sets: allows you to group a list of symbols. It is similar to a profile, except that you see a profile in the main chart and a set in the “Market Watch”;
- Spread: -is the difference between ask and bid prices. If you select it, the spread column will appear in the Market Watch;
- High/Low: adds or removes the columns of the highest and lowest prices of the day in the Market Watch;
- Time: shows the time of the incoming quote;
- Auto Arrange: if checked, it will automatically arrange columns and show all of them, and if unchecked, they will not arrange and may hide some of them;
- Grid: makes appear or disappear the Market Watch grid lines;
- Popup Prices: open a new table containing ask and bid prices that stay in front of all apps on your computer. For the first time, you will not see it well. Right-click and click on properties, check custom size, and increase the size of points. You may also add some columns in the popup prices if you wish.
Data Window
The Data Window displays information about the Date, Open, High, Low, Close, Volume, and technical indicators on the chart.
You can insert the Data Window from the standard toolbar or by going to View and clicking on Data Window.
From the left, the second column shows information about the last candle, and the third column is about the first candle on the chart.
The last rows display technical indicators on the chart plus their values.
Moreover, you can show or hide some of Data Window’s parameters by right-clicking and checking or unchecking them.
Navigator
The Navigator window allows a quick way to navigate to Accounts, Indicators, Expert Advisors, and Scripts.
You can open the Navigator window by clicking on its icon in the standard toolbar or by going to view and clicking on Navigator.
Here is a short introduction:
- Accounts: This group shows a list of your account and your broker. To see what you can do, right-click on one of your accounts, and the available tasks will be displayed. In addition to your account-related things, you can run VPS. VPS stands for Virtual Private Network. VPS is like a PC; however, somewhere maybe in other countries, you can use it remotely.
- Indicators: this group shows the available indicators sorted into groups such as trends, oscillators, volumes, and so forth.
- Expert Advisors: are robots that place a trade on your behalf as optimized. A list of advisors is also available in this group.
- Scripts: is a program written in MQL4, for a single performing of any action.
Terminal
The terminal window contains things related to your fund in your broker and trading activities. I introduce Terminal’s elements, but not all of them in detail, because some of them, need separate articles.
Let us start from the menu bar of the Terminal, located at the bottom of the window.
- Trade: this tab of Terminal has columns starting with the symbol and ending with profit. Here are brief introductions.
- Order: Every time that you place a trade, a ticket is generated for accounting and further references such as reports and claim;
- Time: time represents the moment you placed your trad;
- Type: type represents orders type such as buy and sell;
- Size: the value or lot of money you traded;
- Symbol: represents the asset that you have traded. For example, if you Euro and sell USD, the symbol will be EURUSD;
- Price: represents the price that you paid;
- S/L: represents the Stop Loss level;
- T/P: represents the Take Profit level;
- Price: the second pirce column represents the current market price;
- Swap: represents the value of the swap that your broker charges you;
- Profit: represents if you made a profit or loss;
- Comment: This allows you to put a comment for yourself; and
- Under the title of the column, you see your balance (the amount before trades that are placed), Equity (free margin + margin± profit), margin (amount of fund used for placing your trade/s), and free margin (available fund for trade).
- Exposure: Exposure represents the share of assets you traded in the past;
- History: represents the history of your trades in detail. I will write a separate for analyzing the history;
- News: economic news offered by your broker;
- Mailbox: all emails sent to you by your broker;
- Market: is a place you can buy Expert Advisors and Indicators;
- Alert: the Alert tab shows the list of price alerts you created for yourself;
- CodeBase: you can download applications from the MQL community;
- Experts: you can see here the result of your expert advisor’s performance; and
- Journal: all activities performed in the past will be listed here.
Strategy Tester
Strategy tester is window where you test your expert advisor (robot) before you use it with real money.
You can insert Strategy Tester from the standard tool or visit the View tab and click on Strategy Tester.
Testing a robot is a huge topic. And it is not possible to compress it inside this article.
So, very soon, I will write about it.
The remaining commands in the standard toolbar do not need explanation since we covered them earlier in this article or will do in a separate article.
So, let us go to Line Studies Toolbar.
Line Studies Toolbar in the MetaTrader 4
Line Studies Toolbar is all about putting lines on your chart to do technical analysis.
Some of the Line Studies components need a separate article because they require skills and experience to use them.
So, I only introduce its basics.
You can hide/show the Line Studies toolbar from View>>Toolbar.
These tools are used to draw patterns, levels, channels, and shapes. Traders use them to analyze a chart technically.
From the list, the horizontal line, trendline, and the Fibonacci Retracement are the most popular tools. Traders draw horizontal lines to define support and resistance lines, trendlines to draw a pattern such as triangles, and the Fibonacci Retracement is used to predict possible support lines after a pullback.
Here are some of the articles that cover tools of this toolbar:
- Support and Resistance Lines: How to Trade and Examples
- What Is Trend in Finance? How to Determine a Trend?
- What are Fibonacci Numbers, Golden Ratios, and Tools
Charts Toolbar in MetaTrader 4
Charts toolbar is about your main chart’s look, without inserting anything.
However, it has an option that lets you add indicators at the bottom of the chart.
First, take a look at the following image.
From the left to the right, I explain them in the following.
- Candlestick: shows open, low, high, and close of the timeframe like a candle.
- Bar chart: shows open, low, high, and close of a timeframe, however, bull and bear bar has the same color. It also does not look good.
- Line chart: shows a graph that connects the closing price of selected timeframes.
- Zoom in: makes the candle size bigger.
- Zoom out: makes the candle size smaller.
- Tile window: shows all opened charts but smaller in size.
- Auto-scroll: turns the auto scroll on and off and you also can find it in the common tab. When you click on it, the chart will scroll to the end.
- Chart shift: turns the shift button on and off that you can find on the common tab too. If turned on, a down arrow will appear at the top-right side of the main chart.
- Indicators list: You can insert an indicator from here too.
- Periods: is another method to select a timeframe.
- Step by Step: lets you study by appearing a candle each time you click on it. Remember to turn off auto scroll and chart shifts when you want to see chart evolution step-by-step. It helps you to study how a chart evolves.
- Templates: This option lets you save or select a chart template. And we discussed how to create, save, and apply a template earlier in this article.
Timeframes Toolbar in MetaTrader 4
The Timeframes toolbar has a list of periods that you can apply on the chart. They start from one minute to monthly options.
For example, if you apply the 15 minutes (15M) on the chart, each candle represents a 15-minute period. It means that each candle starts and ends in 14 minutes. The same applies to a bar chart.
However, in a graph chart, the closing price location on the chart changes after 15 minutes.
Bottom Line
I explained in this article how to use MetaTrader 4.
However, I did not explain how to analyze a chart, run Expert Advisor, and some other critical things.
Covering everything in MetaTrader 4 requires over 100,000 words, probably more. That is why, a reader should not expect to cover all subjects in the MetaTrader 4 in one article.

