The US Construction Spending is released monthly and indicates changes in the total value of construction projects completed in the given month compared to the previous month.
Because weather and seasons impact hugely spending on constructions, this report is released in a Seasonally Adjusted Annual Rate (SAAR) and unadjusted versions.
Notice that the collection of data and adjustment is hard. So, the report of a month is released multiple weeks later from the end of the given month.
Types of Constructions
Construction Spending is a survey index. This survey includes spending on new construction projects and altering old buildings (ex. renovations and replacements).
Renovation includes installing systems such as elevators and air-conditioning.
Moreover, the Construction Spending includes residential and residential, reconstruction and new projects, and private and public buildings.
The Census Bureau divides construction into Private and Public. Next, each of them is divided into residential and non-residential buildings.
Private residential buildings are of two types: single-family and multi-family buildings. Non-residentials are lodging, office, commercials, healthcare, educational, religious, public safety, and other constructions funded by the government.
Construction Spending Example
On Dec 1, 2023, the U.S. Census Bureau released the total amount spent on construction for October 2023.
It shows that Construction spending during October 2023 estimation was at a seasonally adjusted annual rate of $2 trillion.
Moreover, the data shows an increase of about 50% since early 2017.
To read the whole report download its official document.
What Costs Are Included?
According to the US Census Bureau, the Construction Spending index calculates the cost of materials and labor, architectural and engineering work, overheads, interest and taxes paid during construction work, and contractor’s profit.
The Importance of Construction Spending
Construction Spending is a huge part of the GDP, accounting for over $2 trillion in a Seasonally Adjusted Annual Rate (SAAR) in October of 2023.
It helps users to understand better the overall economy. Investors and government officials use this data to forecast other economic indicators, such as the unemployment rate and consumer spending because new homes need furniture, appliances, etc.
An increased spending on construction may indicate that the economy is growing and vice versa. Moreover, this data is included in the GDP making an indicator of the whole economy.
So, a reading better than forecasted may have a positive impact on the USD quotes and the US stock market.
However,
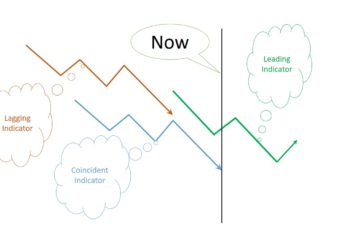
Due to seasonal changes and weather influence, this indicator has a limited impact on the stock market and the USD currency pairs. That is why it is not a leading economic indicator.
Bottom Line
The Construction Spending measures the change in the total dollar amount spent on new constructions and altering buildings. The data is collected by a survey by sending mail and released in unadjusted and seasonally adjusted versions.
This indicator due to volatility, weather influences, and data being about the past, has a limited impact on financial markets.
It is recommended to use this indicator with other real estate indicators such as housing starts, building permits, and existing home sales.

