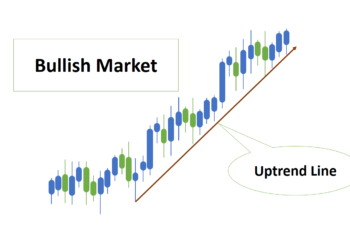
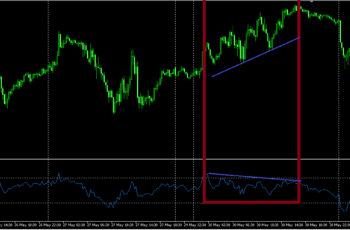
Moving averages are indicators that move alongside price movements. They are lagging (trend) indicators because they help you define if the market trend is upward or downward.
Numerous traders define a trend by Moving Averages. For example, in an uptrend, if a moving average crosses from the bottom of the price line to above, the trend has changed from an uptrend to a downtrend, and vice versa.
In this article, I explain Moving Averages completely from their formula to the types of moving averages.
Read more: Technical Indicators: Types and How to Use Them?
The Period in Calculation of Moving Averages
In a moving average indicator, the period indicates the number of sessions or number of candlesticks used in its calculation.
In the moving averages, you are free to select the number of candlesticks to be used in the indicator construction. However, the most famous periods (number of candlesticks) are the 14, 24, 36, and 200.
A small number moving average is more sensitive to price action moving closer to the current price. On the other hand, a large number is less sensitive and moves with distance from price movements.
If you apply a shorter period in a moving average indicator, it will cross the chart line more frequently and provides too many signals but is less accurate. Specifically, during consolidation, it will generate too many false signals.
On the other hand, higher moving averages are less sensitive. It means that if you use more periods (candlesticks), you are given fewer signals and more accurate but later.
In the above chart, I applied two Simple Moving Averages (SMA) 100 and 200 respectively. The Dark Green line is 100 SMA, and the red line is 200 SMA. You can see that 100 MA (a shorter MA) moves closer to the price and 200 MA (the longer one) move with more distance from the price. Additionally, you can see that a shorter SMA crosses the price line more frequently than the longer one.
Price Application on Moving Averages
In the calculation of Moving averages, traders commonly use the closing price of sessions. You also can use open, close, high, low, medium price, typical price, and weighted closing price. I will explain the above terms in simple words in the following.
- Close: It is the exact price when the session (time-frame) ends
- Open: It is the opening price of a period (candlestick)
- High: The highest price of a session (candlestick)
- Low: Lowest price of a session (candlestick)
- Medium Price (HL/2): Medium price of a range (Highest price + Lowest price divided by two)
- Typical Price (HLC/3): Adding the three highest, lowest, and closing prices of a session and dividing by three.
- Weighted Close (HLCC/4): It is calculated by adding the highest, and lowest, multiplying the closing price by two, and finally dividing by four.
Applying different prices on moving averages has different meanings and implications. Any of the above prices that you choose produce a slightly different moving average line (graph) on your chart. You have to experience all of them separately to find out what suits your strategy the best.
The closing price is considered more important because, at end of a session, a financial asset is priced fairer than at the beginning and middle of a session. It is believed that investors and traders during the day find the fair price of an asset by discussion, reading reports, and following news, for example. That is why the closing price is used more than any of them.
Methods Used for Calculation of Moving Averages
Moving averages are different based on price emphasis on candlesticks. Various methods weigh earlier, middle, and last candlesticks distinctively. Each method displays the graph differently.
Traders use different methods because it is subjective. Some traders prefer to put weight on last candlesticks, while others do not distinguish. You have to find what suits you the best for your personality and trading strategy.
Typically, there are three ways to calculate moving averages, and they are:
Simple Moving Average (SMA)
A simple moving average takes average without weighing differently first, middle, or last candle (I use a candlestick instead of a bar or other charts because every trader uses it). For example, if you are using 14-period moving averages, the last 14 candlesticks are considered in the calculation. When a new session opens, it drops one candlestick from the beginning and adds the new candle into the measurement.
Example of Simple Moving Average (SMA) Calculation
Suppose that a stock price ends with the following prices: 4,7,6,4,8,5,7,7,8,5. Calculate the Simple Moving Average of these values applied to closing prices.
Solution:
- The first value of SMA: (4+7+6+4+8)/5=5.8
- The second value of SMA: (7+6+4+8+5)/5=6
- The third value of SMA: (6+4+8+5+7)/5=6
- Fourth value of SMA: (4+8+5+7+7)/5=6.2
- Fifth value of SMA: (8+5+7+7+8)/5=7
- Sixth value of SMA: (5+7+7+8+5)/5=6.4
Putting the result of these solutions, give the SMA graph.
In the above chart, you see the graph of SMA for six days. You may ask, why six days MA while we had 10 days closing prices? The answer is that we calculated 5-day (5-candlesticks, sessions) MA, so we need to have at least 5 sessions to start the calculation.
Exponential Moving Average (EMA)
An Exponential Moving Averages emphasizes the value of the last session or sessions. Some traders prefer this type of moving average because they believe that the last sessions are more important.
Exponential moving averages are more sensitive than Simple Moving Averages and Lagging Moving Averages.
Example of Exponential Moving Average Calculation (EMA)
To solve an example of EMA, we consider the above closing prices.
The formula of Exponential Moving Average:
EMA = EMAy + WM(Current Closing Price – EMAy)
In the above formula:
- EMA: Exponential Moving Average Current Candlestick
- EMAy: Exponential Moving Average of yesterday
- Current price: the latest price of a candle
- WM: Weighted Multiplier = 2/(N+1) where N represents the number of candlesticks in the calculation.
Now let us calculate the EMA of the closing price of a stock that ended with the following prices: 4,7,6,4,8,5,7,7,8,5.
Note: to start the calculation of EMA for the first time, we consider the last SMA as the previous EMA because we do not have the previous EMA.
We need Weighted Multiplier (WM) for every time of calculation so let us first calculate it.
WM = 2/(5+1) = 0.33
- The first EMA equals to SMA = (4+7+6+4+8)/5=5.8
- The second EMA = 5.8 + 0.33(5 – 5.8) = 5.53
- The third EMA = 5.53 + 0.33(7 – 5.53) = 6.01
- Fourth EMA = 6.01 + 0.33(7 – 6.21) = 6.27
- Fifth EMA = 6.27 + 0.33(8 – 6.27) = 6.84
- Sixt EMA = 6.84 + 0.33(5 – 6.84) = 6.23
To draw the EMA line the only thing that we need to do is to connect the results of these calculations.
Smoothed Moving Averages (SMMA)
A Smoothed Moving Averages makes the moving average graph/line calm/smooth to calm down short-term volatilities. That is why the word “Smoothed” is used to name it.
SMMA does not remove old prices from calculation but its impact gets less and less as time passes. And, it is not as popular as Simple Moving Average.
The first value in a Smoothed Moving Average (at the beginning), is a Simple Moving Average. And, we smooth the next values by the following formula:
SMMA = (PSS – PSMMA + Closing Price)/n
Where:
- SMMA – Smoothed Moving Average of current candlestick
- PSS – Previous time-frames/bar/candle Smoothed Sum for N periods
- PSMMA – Previous Smoothed Moving Average
- Closing Price – Closing Price of current time frame (bar or candle)
- n – Number of bar/time-frame/candle
Example of SMMA Calculation
The first value in SMMA is an SMA. The following values are calculated based on the SMMA formula.
For the calculation of SMMA, we use the above data we solved for the two above examples.
Let us start
Once again, the SMMA formula is: SMMA = (PSS – PSMMA + Closing Price)/n
The closing value set is: 4,7,6,4,8,5,7,7,8,5.
- The first SMMA = {(4+7+6+4+8)/5} = 5.8
- The second SMMA = (29 – 5.8 + 5)/5 = 5.64
- The third SMMA = (30 – 5.64 + 7)/5 = 5.87
- Fourth SMMA = (30 – 5.87 + 7)/5 = 6.22
- Fifth SMMA = (31 – 6.22 + 8)/5 = 6.55
- Sixt SMMA = (32 – 6.55 + 5)/5 = 6.09
By connecting the results of the above example, we get an SMMA line.
Read more: What are Fibonacci Numbers, Golden Ratios, and Tools
Linear Weighted Moving Averages
In a Linear Weighted Moving Average, more weight is given to the recent candles and gradually lowers the weight from the current to the earlier candlesticks.
For example, in a 5-day LWMA, we multiply the value of the recent (fifth) candle by five, the fourth by four, and so on. Finally, we divide by the sum of the weights (5+4+3+2+1=15).
LWMA formula: LWMA = {(PnW1) + (Pn-1W2) + (Pn-2W3) + (Pn-3W4)….}/Sum of Ws
Among moving averages, the linear moving average is more reactive (sensitive) than SMA, EMA, and SMMA. It is more sensitive because of the more weight that it puts on the recent candles.
Example of Linear Weighted Moving Average (LWMA) Calculation
To create a graph line example of LWMA, we continue the calculation of values using the above closing prices.
Once more, the closing prices of our hypothetical stock are 4,7,6,4,8,5,7,7,8,5.
We calculate 5-day (5 candlesticks) to understand LWMA.
Once more, the LWMA formula is:
LWMA = {(Pn*W1) + (Pn-1*W2) + (Pn-2*W3) + (Pn-3*W4)….}/Sum of Ws
- The first value in LWMA = {(8*5) + (4*4) + (6*3) + (7*2) + (4*1)}/(5+4+3+2+1) = 6.13
- {(5*5) + (8*4) + (4*3) + (6*2) + (7*1)}/(5+4+3+2+1) = 5.86
- {(7*5) + (5*4) + (8*3) + (4*2) + (6*1)}/(5+4+3+2+1) = 6.2
- {(7*5) + (7*4) + (5*3) + (8*2) + (4*1)}/(5+4+3+2+1) = 6.53
- {(8*5) + (7*4) + (7*3) + (5*2) + (8*1)}/(5+4+3+2+1) = 7.1
- {(5*5) + (8*4) + (7*3) + (7*2) + (5*1)}/(5+4+3+2+1) = 6.7
By connecting the above results, we get a Linear Weighted Moving Average (LWMA).
Read more: Three Main Economic Indicators
All Graphs of MAs in One Image
To compare various types of moving averages, I have put all of them in one image.
In the above image, you see that shapes vary. And, they even cross each other in some places.
If you want a smoother MA, then SMMA and SMA are better. On the other hand, if you want to weigh recent candlesticks, then EMA and LWMA are better choices.
It is always good to practice, and find the best one that suits your strategy.
Shifting MAs
In some software like MT5, you can shift the moving average line to the left or right of the current price.
Some traders believe, that shifting a moving average backward at the middle of the period is the correct way to place it. For example, if you are using 14 candlesticks moving average, they put the moving average of seven candlesticks back, which is the center of 14 candlesticks.
Shifting to the right side doesn’t work at all. You can try it to see if something is happening.
In my own experience shifting the line of moving average forward or backward makes analysis more difficult. Placing the moving average backward or forward provides too early or late trend change signals. Moving averages determine the trend so, it will not be helpful if it gives you too early or too late trend change signals.
In the above chart, I shifted 200 Moving Average to the right by 20 candlesticks.
How to Use Moving Averages?
As you read, there are various types of moving averages.
All of them say the same story but differently. They define the price of a financial instrument as if it is upward or downward.
What type of moving average should you use? There are no strict rules. It is up to you and your strategy. You may need to experience and practice to find the one that suits you perfectly.
I prefer to use moving averages just for their simplicity. Additionally, I define a trend by chart pattern and an oscillator such as MACD and RSI.
I think should not rely on a single tool to decide a trend’s direction. It is always better to combine your analysis with indicators, patterns, fundamental analysis, etc.
Adding MAs in MT4 and MT4
For inserting moving averages in MT4 and MT5, you have two options.
First, go to Insert>Indicators>Trend and click on Moving Average.
The second way to insert a moving average is by going to Chart Toolbar.
Read more: Equidistant Channel in MT4: Complete Introduction
Properties of MAs in MT4 and MT5
To open the window of properties, right-click on the Moving Average line and lift click on MA properties.
The window of properties has three tabs, parameters, levels, and visualization.
- Parameters tab contains Period, Shift, MA Method, Apply to, and style. We discussed it earlier, so we do not repeat it here.
- In the levels tab, you can add more lines that move at a specific distance from the main MA line.
- The visualization tab shows time-frames that you want your MAs to appear.

