The MACD indicator is a leading indicator that predicts possible trend reversal or upcoming consolidation period. It stands for Moving Average Divergence Convergence.
The MACD window consists of a histogram and a line, or two lines without a histogram in some trading platforms.
In those soft-wares that use a histogram instead of one of the two lines, the faster line (or more sensitive one) is the same as the histogram in software that doesn’t use a histogram.
In this article, I explain MACD Indicator lines calculation, settings, and how to trade it.
Read more: Bollinger Bands Indicator: Strategy, Calculation & Examples
Calculation of MACD Indicator
The MACD is made of moving averages, unlike other oscillators that use mathematical formulas.
In two-line MACD, the faster line represents the difference between two exponential moving averages, a slow EMA (exponential moving average) and a faster EMA. The second line is an SMA (simple moving average) or Exponential Moving Average (EMA) of the faster line. For drawing the second line, in some software, SMA is used, and in some software EMA.
Mathematically, the formula for a faster line in the MACD window is: MACD = Fast EMA (ex: 12 periods) – Slow EMA (ex: 26 periods)
And, the signal line or the slow MA in the MACD window formula is: Signal = SMA/EMA (ex: 9 periods) of MACD line
The MACD window doesn’t have an upper and lower limit vertical scale. It means that the window automatically adjusts to the differences between the fast EMA and slow EMA.
The MACD has a centerline (zero line). If yours doesn’t have, then you add one. Above zero line means bulls are more powerful, and below zero line bears.
Read more: What is the Stochastics Oscillator & How to Trade It?
Settings of MACD Indicator in MT4 and MT5
To insert MACD Indicator, go to Insert, Indicators, and Oscillators and click on MACD.
In the MACD settings tab, you have four tabs: parameters, levels, scale, and visualization.
Parameters tab:
- Fast EMA and Slow EMA: these two EMAs make the faster line in the MACD Indicator window at the bottom of the chart. First Fast Exponential Moving Average (EMA) is calculated, it is slowed by the “Slow EMA” number.
- MACD SMA: it is the slower line in the MACD indicator.
I think the rest of the settings are self-explanatory. So, it is not necessary to write about it here. If you want to read it, I have written in detail about it in the following article.
Read more: What is the Relative Strength Index (RSI) & How to Trade It?
How to Trade MACD Indicator?
The MACD Indicator is helpful by signaling the time of entry and generates signals by diverging and converging.
MACD lines Signal the Time of Entry
In the MACD indicator window crossover of the faster line (or histogram) and slow line suggests thinking of placing a trade.
In the upper section of the MACD window, when the faster line (or histogram) falls below the slow line, it means to consider going short. On the other hand, when the faster line rises above the slow line, it is time to consider going long.
Notice that every crossover does not mean to trade because most of them fail to continue. You need to confirm crossovers with chart patterns and maybe fundamental data and analysis.
In the above chart, I have highlighted failed signals with white color vertical lines, and correct signals with red vertical lines.
As you see not all crossovers happen to be helpful. In fact, most of them fail.
You have to look at other confirmations and signals such as chart patterns and fundamental news to make a trading decision.
Read more: Momentum Indicator: Calculation and How to Trade
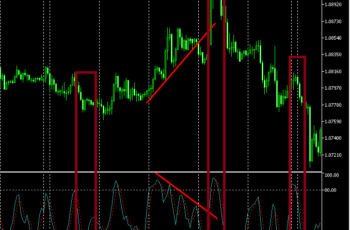
MACD Divergence and Convergence Provide Trend Reversal Signals
A MACD generates a signal when convergence or divergence appears between the price line and the MACD lines.
The MACD shows overbought conditions when the price makes new highs while the MACD lines fail. It predicts a possible future downtrend or a consolidation. And, shows oversold conditions when the price line (trend) makes new lows while the MACD starts going upward. It is a bullish reversal sign or a correction.
In the above chart, I have highlighted failed signals with blue and successful signals with red colors.
As you can see in the chart, MACD does not always produce successful signals.
It is always better to see for other confirmations such as chart patterns and economic news as well to place your trade. The MACD Indicator alone tells you nothing.
Read more: Commodity Channel Index (CCI) Fully Explained
Practice MACD In Real Chart
Click on “f(x)>Momentum Indicators>Moving Average Convergence/Divergence” and set as you wish to insert the MACD indicator.
Bottom Line
Using the MACD Indicator may lead you to huge losses. Practice and see past charts to see what happened in the past and gain experiences.
I recommend you never rely on a single analysis tool such as MACD. Combine your analysis with other techniques such as Intermarket analysis, chart patterns, candlestick patterns, and fundamental analysis.

