What Is Technical Analysis?
The title says about six reasons to use technical analysis. So, what is technical analysis?
Technical analysis or examination of charts using chart tools and patterns is the most popular way of studying market behavior.
Technical analysts claim that everything in the world repeats itself. Everything goes up and down. While going up and down, they create chart patterns in the market. And they repeat consistently forming the same structure. Moreover, most of the time, they are reliable and discoverable.
Technical analysis is more about chart patterns or structure. That is why in this article, you read it a lot.
Notice, that I do not undervalue the fundamental analysis. In fact, fundamental analysis is a must for investors who wants to gain in the long term. For example, investors should study the demographic and trends of many industries in India and China extensively before investments.
Even wars create a pattern on the chart. In those times, analyzing the market is much easier and more accurate than studying how wars impact the market.
This article expresses six reasons to use technical analysis that you should need to learn and practice.
Follow us on social media:
1. Following Fundamentals Is Difficult
Countless factors affect market prices, even a tween from a celebrity or a CEO. Following all of them and reading every report is impossible. For example, a tweet from Elon Musk can impact hugely on cryptocurrencies and the stock price of Tesla. Elon Musk is one of the thousands of CEOs.
Fundamental analysis requires a lot of knowledge. You need to know at least basic economics, new technologies, matured technologies, financial analysis (ex: accounting and financial statements), political systems, laws in various nations, etc.
You not only need to know more to analyze fundamentally but also follow up. To analyze fundamentally, it is a must to follow the news. Analyzing news also requires first-hand experience. In most cases, you need to understand several things to understand the news.
There are countless decision-making authorities in the world. For example, European Central Bank is one of many organizations whose decisions impact the market. Go to its YouTube channel to see how many new videos it uploads. Remember that it is one of several entities that influence the financial market.
A few years ago I asked one of my friends to tell me the reasons that he prefers technical analysis. He replied, “I am lazy, and I can’t read a lot.” I understood from his reply that fundamental analysis is very beneficial but not a good choice for those who can not read too much.
Read more: What are Chart Patterns and Types of Patterns?
2. Technical Analysis Requires Less Time
Less time requirement is one of the main reasons to use technical analysis.
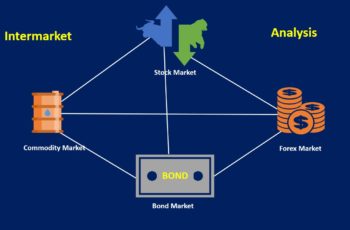
Technical analysis requires much less time than fundamental analysis. A technical trader reads the chart and checks macroeconomic data in the economic calendar. Reading a chart only requires changing time frames on the chart, and maybe going back or checking indexes and other symbols for Intermarket analysis purposes. All of these can be done in minutes or at most one hour.
On the other hand, fundamental analysts study economics, social trends, news, macro data, listen to speeches, and more. Following all of these factors requires patience and mental strength. There is no one, two, or three news outlets or organizations that report financial data, but thousands across the world. An investor needs to read about China’s and other countries’ economic performance too because they, directly and indirectly, impact the performance of American and Canadian companies.
Read more: Fundamental Analysis of Stocks
3. Technical Analysis Requires Less Knowledge
Compared to fundamental analysis, technical analysis requires many times less knowledge. However, technical analysis requires better emotion management and more time in front of charts. On the other hand, fundamental analysis requires a lot of knowledge from demographics, industries, management, economics, etc.
Generally, wave analysis, chart patterns, technical Intermarket analysis, trend recognition, and understanding of some technical indicator is sufficient to do well in the market. Contrarily, you even may not know every organization that decides for governments and their decisions impact the financial market.
Read more: What is a Trend in Finance? How to Determine a Trend?
4. Discovering Manipulation is Faster
By analyzing technically, investors can detect market manipulations by governments and entities, because active and passive actions in the market, including manipulations, create patterns in the chart.
Big financial institutions such as central banks manipulate the market to manage the market.
If non-governmental institutions influence the market, they aim to profit at the cost of regular investors.
On the other hand, the fundamental analyst will detect manipulation very late because he is looking for the root cause of the change that might not spread at all. Before a fundamental analyst finds the root cause of a drop in the stock market or forex market, it is gone.
5. Every Financial Decision Create or Helps a Pattern Creation
Every movement in the market creates or helps create a pattern. If the move is due to political decisions, economic decisions, or something else, it creates a chart pattern or structure.
For example, changing interest rates directly impact currencies and prices in the stock market. And, the decision of the CEO of a company to boost R&D expenses directly impacts its stock price as well, because investors’ expectation moves the price upward or downward.
6. Human Beings Behave in a Certain Way That Creates Patterns
According to technical analysts, human beings behave in specific ways that create patterns and are distinguishable, as they eat and take showers at specified times of the day.
An example would be a mountain climber. He doesn’t go directly up but in a pattern like zig-zag or other ways. After a while, other people climb the same mountain. And most climbers repeat the step patterns of the first one unknowingly. You see then that walking-ways created. The above examples illustrate that human behaves in specific and distinguishable structures.
Think about it. Even empires repeat the past empires’ route.
Thus, everything in the world repeats itself in a certain way that is distinguishable just by analyzing the past data using charts and statistical tools. Examination of historical data with a chart and statistical tools is called technical analysis.
Bottom Line
Learning, experiencing, and doing technical analysis is a must for both investors and traders. Technical analysis is essential because an investor can not find the root cause of a market movement always or may find it later when the price reaches a milestone. Additionally, analyzing speculators’ behavior is very difficult and sometimes impossible.


