A linear regression channel is consist of three lines using a statistical technique that best suits the middle of a dispersed set of values.
The formula of Linear Regression is the following:
Y = a + bX
Where;
X: is a dependent variable
Y: is a dependent variable
a: a constant price
b: is the slope of the line
In the chart of a financial asset, the closing prices of a trend are observations. The price is y-axes, and the time is x-axes. X or the time is the independent variable, and the Y or price is the dependent variable.
To use it effectively, make sure that there is a channel. If there is no channel, it is not helpful at all.
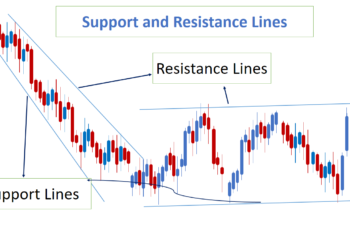
A regression channel has three lines. In this channel, the middle line is a regression line, drawn based on the closing prices of the candlesticks, which act as observations. And, the outer lines represent support and resistance lines in a trend.
The distance of the support line from the centerline is equal to the distance from the resistance line. That is why, if there is no channel, the regression channel is not worth using.
Read more: What is the Standard Deviation Channel?
How to Insert the Linear Regression Channel in MT4 and MT5
To insert the regression channel, go to insert tab>objects>channels, and finally, click on regression channel. You can also insert it from Line Studies toolbar if you have added it.
To draw a regression channel, left-click on a candlestick that you want to be the channel’s beginning and pull it toward where you want it to end.
The regression channel has three lines that go parallel. The centerline is the linear regression line, drawn based on its formula. The two outer lines are drawn automatically by touching the highest closing or lowest closing price from the centerline. Please note, that if you pull the channel beyond the current candlestick, this channel will not work.
To use it more effectively, tick the Ray Left on the parameters tab of the properties of the regression window.
The Properties of a Regression Channel in MT4 and MT5
To open the properties of the linear regression channel, right-click on any dots on the centerline of the channel, and finally, left-click on the first option. It has three taps, namely common, parameters, and visualization.
In the common tap, you can design the lines of the regression channel.
The parameters tab in MT5 contains:
- First Date: represents the starting point ( of the candlestick or timeframe) of the regression channel;
- Second Date: represents the ending point (candlestick or timeframe) of the regression channel;
- Ray Right: if you tick, the channel lines will continue to the right side;
- Ray Left: if you tick, the channel lines will continue to the left side; and
- Fill: if you tick, the color of the channel’s lines will fill it.
Note: in the MetaTrader 4, you may not see some of these options.
Finally, the Visualization tab consists of timeframes in which you want to see your channel.

