What Is a Technical Indicator?
A technical indicator is a built-in financial software developed using statistical tools that measure and show changes and progress of a variable relative to time.
There are numerous indicators available in the market. If you can code, you can make your own. You do not need to understand every single of them as a number of them explain the same thing.
Types of Technical Indicators
Generally, there are three types of technical indicators lagging, confirming, and leading indicators.
Every technical trader needs at least two technical indicators, one leading and another lagging.
Using too many indicators is also not a good idea. They will make traders confused and undecided. I suggest you keep your chart clean and not messy.
Moreover, using technical indicators help investors to manage their emotions more effectively. Warnings and signals from technical indicators convince traders of what occurs in the market and encourage them to be calm.
1. Leading Technical Indicator
Most oscillators are Leading Indicators, and they signal an overbought or oversold market. Leading indicators tell you if the market is overbought or oversold or needs a rest.
Remember that Leading indicators only tell you possibilities, do not tell you that something is assuredly happening.
Most oscillator indicators are leading indicators that help you predict future price movements.
A Leading indicator is placed at the bottom of the chart. It moves in a range. The top of the range predicts overbought, and the bottom oversold possibilities.
The Relative Strength Index (RSI) is an example of a leading indicator. It signals overbought and oversold conditions before trends change direction.
Programmers have developed Every Leading indicator based on different rules. You may need to understand how they work to find the best one that suits your strategy.
How to Use Leading Indicators?
Leading indicators are an essential part of technical traders’ analysis. Using technical indicators is probably a must.
Leading indicators warn and signal traders about possible new directions in the market before it starts.
In my view leading technical indicators help in the following ways:
- Leading indicators help traders to recognize overbought or oversold conditions.
- Leading indicators signal traders to close their open positions before a trend change direction, or a correction wave starts.
- Additionally, it signals to get ready for the next trade. Leading indicators warn us to be aware of a change in the market.
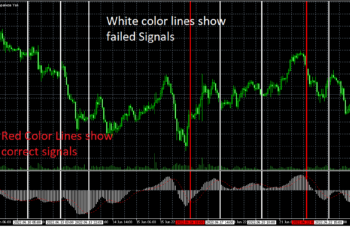
In the above image, you see that MACD diverges from prices when the market is overbought. MACD signals an overbought condition by going down while the price is making new higher highs. I highlighted the price chart where it diverges with MACD in a rectangle shape. It is helpful and makes you prepare for a possible new direction.
2. Confirming Technical Indicator
A confirming indicator, also known as a coincidence indicator, can help a trader confirm his analysis.
This indicator does not predict or signal if a market is overbought or oversold. It moves with the price movement.
Generally, volume indicators are confirming indicators. They confirm price action in the market. For example, if the price moves very fast, the volume will rise and indicates higher volatility.
3. Lagging Technical Indicators
A lagging indicator (also called a trend indicator) follows the current trend (direction) of the market. It tells if the market is going up (uptrend) or down (downtrend). A lagging indicator doesn’t predict or confirm price movement direction.
Mostly, lagging indicators are placed on the main chart and accompany the price itself. An example of them is Moving Averages which are probably the most famous indicator. Moving Averages change direction after price direction changes.
Lagging indicators are good when the market is trending upward or downward. They can provide you with information if you are with the trend or against it.
How to Use Lagging Indicators?
Lagging indicators are also known as trend indicators. They confirm a new trend or the end of the current trend after making sure that it is not short volatility. By short volatility, I mean that both in uptrend and downtrend there are corrections and not a trend reversal.
Trading against the trend is like committing suicide. That is why traders need this type of indicator.
During consolidation (also known as a correction, sideways and lateral), lagging indicators cross prices multiple times. You as a trader should confirm a trend reversal with chart patterns and with the help of other means, such as fundamental analysis and leading technical indicators.
During consolidation, lagging technical indicators can confuse traders by crossing the graph too many times. Thus, do not count on it too much in those circumstances.
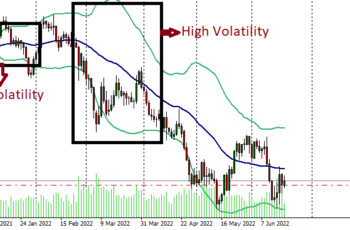
In the above image, during a consolidation period, you see that Moving Average (24) crosses multiple times and a new direction does not happen. Traders need to be alert and confirm new directions with chart patterns and leading indicators.
Bottom Line
Using leading indicators helps you to be aware of a new direction in the market, so it is a good idea to use one.
Lagging indicators help you to stay on the trend and manage your emotions more effectively.
And finally, test and see if a confirming indicator is necessary to be on your chart or not.
Additionally, nothing in the financial market is guaranteed. There is no technical indicator that gives you correct signals all the time. You have to understand and build a strategy that works most of the time.

