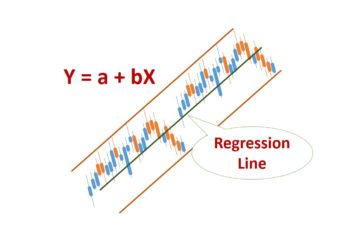
You can make a Moving Average Envelopes Indicator by adding separate lines above and under the moving average line. The two additional lines move alongside the moving average at a specified distance, known as upper and lower bands.
Traders consider the upper band a resistance line and the lower band a support line. They are looking for buying opportunities when the price hit the lower band and for selling opportunities when the price hit the higher band.
You can define the distance (deviation) between the moving average line (centerline) and two bands by points or a percentage.
Read more: Three Types of Technical Indicators
Two Ways to Place Envelopes Indicator on Your Chart
There are two ways that you can use this indicator, placing an envelope indicator in a trading platform such as MT4 and adding levels in a MA. In the MT4 the distance between lines is defined by percentage and in the latter by points.
Placing Envelopes Indicator in a Trading Platform
The first method is the envelope indicator in your trading platform such as MT4. Furthermore, most trading platforms today have this indicator in themselves.
To place this indicator go to Insert>Indicators>Trend and click on Envelopes.
Properties of Envelopes Indicator in MT4
The window of properties in MT4 has four tabs, parameters, colors, levels, and visualization.
- In the parameters, you define the period, shift if you want, price application MA method, and deviation. I have written at the end of this article a lot about “Apply to” (price application) and the MA method. Click here and read it if you need it. In this tab, Deviation is the most crucial thing you need to put in a correct number. Deviation defines bands’ distances from each other and the center. The deviation is calculated in percentage terms so, try to put the right number.
- The color tab is just to select a color for upper and lower bands.
- In the Levels tab, you add additional levels that go parallel with the moving average. You can select positive and negative numbers. Additionally, you can give a style if you wish.
- The Visualization tab is to tick the time frames that you want your indicator line to appear on the chart.
Read more: What are Fibonacci Numbers, Golden Ratios, and Tools
Placing Envelopes Using Levels in SMA
The second way to place an envelopes indicator is to add one positive level and one negative. For example, if you want a moving average channel that the two outer lines moving 20 points in the distance, you need to add one +20 and another -20 points lines.
In the above image, I have added -500 and +500 pints to the 35-MA. In this chart, distances between the upper band and MA, and between MA and lower bands equal 500 points.
How to Read Envelopes Indicator?
A “Moving Average Envelopes Indicator” is helpful when the market is trending. It shows what has happened but cannot suggest the future trend.
Some traders use the this indicator as a signal provider. Envelope traders consider the lower band as a support line and the upper band as a resistance line. They are looking to buy when the price touches the lower band and the upper band for selling opportunities.
Deviation and period (time-frame) define the wellness of envelopes line. As a trader, you have to find the period and the deviation that suits your chart.
You should not select a very long period (number of candlesticks) that makes you lose too many opportunities. You also should not choose a short period (number of candlesticks) that crosses the price too frequently and makes you confusing and undecided. Additionally, deviation also should be selected correctly to make sense and be helpful in your chart analysis.
In the above chart, I have added +700 and -700 levels on the hourly chart of EURUSD. It looks well. You can see that in multiple places upper and lower bands played the role of support and resistance lines. In the end, the lower band confirmed a downtrend, and it happened.
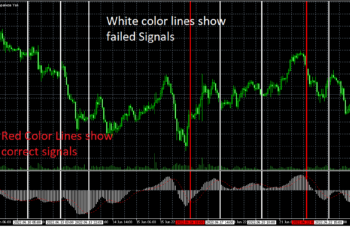
Contrarily, in the below chart, “14-candlesticks envelopes” with a deviation of 0.1 is placed incorrectly. You see that it generates too many false signals. If deviation and period are not selected correctly, the envelopes will be useless and confusing.
A single indicator does not tell the whole story in the market. To make use of it, blend your analysis with other tools and fundamental analysis as well. Practice and play with indicators to find the one that suits your techniques.
Read more: Types of Economic Indicators: Leading, Coincident & Lagging
Disadvantages of Envelopes Indicator
The problem is that one envelope doesn’t work for all time-frame charts.
If you add levels to use envelopes, the indicator measures the distance between bands in points. And they do not fit all time-frames, because, in a daily trend, price ranges more than hourly without changing trend direction. Additionally, if you change the time-frame of the candlestick, it gets even worse. For example, if you change your chart from hourly to daily, your channel will not be comparable at all. If you continue using, you need to change the distance points every time you change the timeframe.
If you use percentage envelopes (trading platform built-in envelopes), the story is almost the same. You need to change settings every time you change time-frames. For example for the hourly chart, a 2% deviation is huge. It does not adapt to changes.
I suggest you experience it yourself. Try to add a moving average channel with different distances and see if it is useful. Anyway, you have to experience to learn.
Like any other moving average, this indicator creates too many false signals when the market is going sideways. It crosses prices frequently and adds no value.

