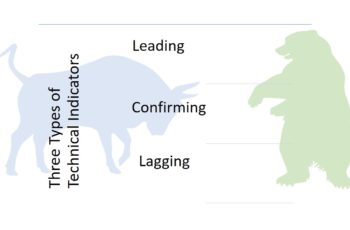
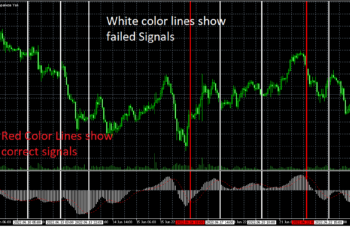
Momentum Technical Indicator is a leading indicator that signals an overbought or oversold situation by oscillating higher or lower in the indicator chart. It oscillates in the indicator window and that is why some people call it one of the oscillators.
Generally, this indicator is put below the price chart in a separate window.
Read more: Bollinger Bands Indicator Fully Explained
Settings of Momentum Indicator in MT4 and MT5?
To insert a momentum indicator in MT4, go to Insert tab>Indicators>Oscillators and click on the Momentum.
The momentum indicator window has properties making you able to change the setting that suits your strategy.
The vertical scale ranges from bottom to top, ranging around zero or 100 points. These numbers change as the chart periods (time-frames) change and also when zoom in and zoom out the chart window (main window).
The properties of the momentum window consist of parameters, levels, scale, and visualization.
The parameters tab allows to select:
- Period: The period (number of days or any time frame) for calculation;
- Apply to: choose the price you want to apply, such as close, open, high, low, etc.
- Style: select the color and thickness of the dotted line.
The Levels tab allows to:
- Add: you can add by putting a number and optionally writing a description
- Delete: by selecting a level you can delete it
- Edit: you can choose and edit a level
- Line settings: you can change the color and stickiness of the line
The Scale tab exists in MT5, not MT4, allows to:
- Inherit Scale: When ticked inherit scale, it copies the scale from the previous indicator.
- Inherit by line: You can select the middle line position in percentage from bottom to top. For example, if you enter 25%, the middle line of the momentum will be at a 25% point from the bottom of the indicator window. If you tick the scale value, you can set a specific number between the bottom and top value in the indicator window.
- Fixed minimum and fixed maximum: it is better to not tick, and set a number because standard momentum should not have lower and upper boundaries. If ticked, the boundaries of minimum and maximum will activate.
Visualization tab
This tab allows you to choose the time frames you want the momentum indicator to show.
Read more: Technical Indicators: Types and How to Use Them?
How to Calculate Momentum Indicator?
As mentioned, the middle line of momentum is the zero line or the 100-point line, and they are calculated a little differently.
The zero middle line momentum is calculated by the following formula:
M=P-Px
Where:
M – Momentum line
P – Current price
Px – Price of n days (or periods) ago
The 100 middle line momentum is calculated by the following formula:
M = (P/Px*100)
Where:
M – Momentum line
P – Current Price
Px – Price of n periods age
Read more: Moving Average Envelopes Indicator Fully Explained
How to Trade Momentum Indicator?
The standard momentum technical indicator has one line/level in the middle of the indicator chart. If you do not see you can add one in the settings of Momentum Indicator. If the momentum line oscillates around zero, add a level with zero value. And, if the momentum line oscillates around 100, add a level with a 100 value.
By default, most trading platforms also do not have any upper or lower lines. You can put a line based on the historical chart above and below of middle line to help you find the overbought or oversold assets.
You have to go back and add levels that prices range 95% of the time between upper and lower lines.
Above zero line or the 100-point line indicates a bullish market and under this line a bearish market.
When the indicator line in the indicator window is above the middle line and crosses to the below, it is a bearish or a correction signal. On the other hand, when the momentum line is below the middle and crosses above the middle, it signals a bullish trend or a correction period.
The momentum technical indicator leads the market by diverging or converging with price movements. Diverging means that the price goes one way, and the indicator line goes another way (shown in the next chart).
When the momentum line is below the middle line, and there is a convergence between price action and the momentum line, it indicates that a bullish market is possibly coming soon. On the other hand, when the momentum line is above the middle line of the indicator and diverges from the price line, it signals a possible downtrend in the future. Thus, the momentum warns the trader that the next movement is likely.
The momentum helps a trader when the price goes extreme high or low. When there is a divergence between price action and momentum, it signals a possible reversal trend or breakout of a correction.
A momentum indicator can also confirm a correction pattern by copying the price chart somehow. You can spot consolidations in the indicator window, helping you manage your trades more effectively. Moreover, a Momentum Indicator also signals when the price breaks a pattern. The pattern on the indicator window breaks ahead of the break in the chart pattern. It is also a signal that the price breaks patterns upward or downward.
Read more: All Moving Averages (SMA, EMA, SMMA, and LWMA)
Check the Momentum Indicator In Real Chart
Click on “f(x)>Momentum Indicators>Momentum” and set it as you wish to insert the indicator.
Bottom Line
Using a leader indicator such as Momentum is very helpful for traders. It helps a trader to manage his emotions by looking at them and confirming if a movement that he expects is likely or not.
Remember that chart pattern and trend is the primary tool, and the indicators are secondary tools. So, you have to always look at the price chart if there is a pattern that suggests continuation or reversal and then the momentum indicator.
You should not also forget that most of the time market is consolidating. Only probably 30% of the time it is trending. An oscillator-like momentum indicator is one of the best tools to predict the next movement.
Finally, no indicator should be used alone. Try to combine your analysis always with chart patterns, news, events in the economic calendar, and fundamental analysis. These tools act as confirmations that help you make better investment decisions.

