Fibonacci Expansion is also known as Fibonacci Extension. It tells you the possible prices that a trend can reach before the start of another wave, correction, or a pullback.
In other terms, the Fibonacci Retracement is used to identify a price to open a trade, and the Fibonacci Expansion is used to identify a price to close an open position.
Read more: What is A Fibonacci Retracement & How to Place It?
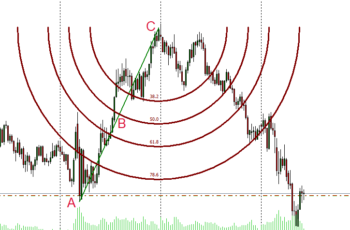
In the Fibonacci Expansion, the distance from the start to the end of the impulse wave (A to B in the above image) is 100% (or just 1). The number on Fibonacci Expansion (FE) levels represents their distances in vertical scale from the end (C in the above image) of the correction wave (second wave) relative to the impulse wave (the first wave, which is considered 100%).
For example, the FE 100 means that the distance from the end of the correction wave to this level vertically equals the impulse wave vertical value. And, the 61.8 FE level means that its distance from the end of the correction wave is equal to 61.8% of the impulse wave in vertical value.
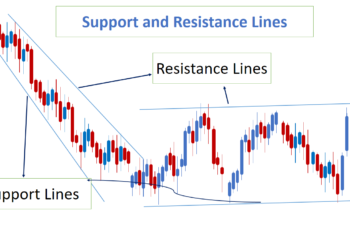
Each of the Fibonacci level in the chart, based on studies, predict possible support or resistance line. Based on the situation of the market, you need to target a specific level. If the price crosses your target level, it is better to target the next level.
Does Fibonacci Expansion Work?
In the financial market, a guarantee does not exist. You have to practice and experience it yourself. All the FE levels only represent possible resistance and support levels. You cannot rely on any of them.
In my personal view, the Fibonacci expansion and retracement are proper tools only to measure the expansion and retracement levels. You can not rely on them to define your entry and exit points.
Inserting Fibonacci Expansion (FE) in MT4 and MT5
To insert FE, go to the insert tab>objects>Fibonacci and finally click on the Fibonacci Expansion. You can also add it from Line Studies toolbar if you have added it.
To draw a FE there should be a spike (impulse) and a pullback (retracement) in the chart. The Fibonacci Expansion has three controlling points. Put the first controlling point at the start of an impulse, the second controlling point at the end of an impulse (spike), and finally, the third controlling point at the end of the pullback.
Now that you draw your Fibonacci Expansion, you see the Fibonacci levels that you have added. If you want to add or delete one or some of them, you have to open the Fibonacci Properties Window in the Level tab.
Properties of the Fibonacci Expansion
To open the Properties of Fibonacci Expansion, click on any controlling point of this tool and click on the Properties of Fibonacci Expansion.
The FE window has four tabs. They are namely Common, Level, Parameters, and Visualization.
The Common tab contains:
- Name: to name your Fibonacci Expansion (FE);
- Description: to describe your FE for later references;
- Style: select the thickness and color of your waves;
- Draw object as background: if checked, you will draw the FE as background; and
- Disable selection: if ticked this one, you can not select it for modification and deletion. You can only delete it by right-clicking on one of the controlling points, then clicking on the first Object List, and finally, finding the FE and deleting it.
The Levels tab contains:
- Levels: you can add Fibonacci Expansion levels, name, and put a description. You also can delete and edit the ones that you don’t need; and
- Style: you can choose the color and thickness of levels.
The Parameters tab contains:
- First Date and Value: It represents the start of the impulse wave;
- Second Date and Value: It represents the end of the impulse wave (start of the correction wave);
- Third Date and Value: It represents the end of the correction (start of a new impulse wave);
- Ray Right: If checked, the Fibonacci Extension levels will continue to the right; and
- Ray Left: If checked, the Fibonacci Extension levels will continue to the right.
And finally, the Visualization tab contains timeframes in which you want to see your Fibonacci Expansion (FE).
For example: in the above chart starting point of impulse is 100%, and the end of it is 0%. If the price fall below 0%, it has expanded instead of retracement. On the other hand, if the price moves upward to 50%, it has retraced 50%. Traders pay more attention to these levels for possible resistance lines.

