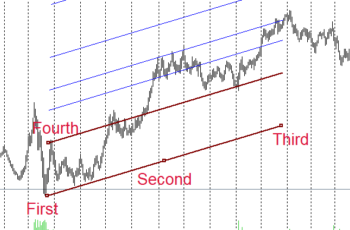
A trading platform creates the Standard Deviation Channel on the chart based on the Standard Deviation formula. It is a statistical technique that shows the dispersion of a set of values from the mean.
How to Calculate Standard Deviation?
Standard Deviation is the square root of the variance. Thus, to calculate Standard Deviation, you need to understand and calculate the variance. Variance is the average of squared differences from the mean.
In the above formula:
To find out the Standard Deviation you need to (1) find the mean of a set of values (2) find the variance; and (3) find the standard deviation.
Example:
Find out the standard deviation of 1, 2, 3, 4 and 5
Answer:
In the above example, you see that the standard deviation is greater than the mean. Yes, it can be greater than the mean when a set of values is more spread or dispersed.
A small standard deviation indicates a less dispersed set of values. And a greater standard deviation indicates a more dispersed set of values.
68-95-99.7 Rule in Standard Deviation
The 68-95-99.7 is known as the empirical rule and indicates that:
- 68% of the values fall within one standard deviation of the mean;
- 95% of the values fall within two standard deviations; and
- 99.7% of the value falls within three standard deviations of the mean.
Standard Deviation Channel in MT4
To insert the StdDev Channel in MT5 and MT4, follow insert>objects>channel and click on StdDev Channel. Furthermore, you can add it from the Studies Lines toolbar if you have added it.
The Standard Deviation channel has three lines. The two outer lines represent the StdDev lines, and the middle line represents the mean of the prices within the selected candlesticks or price line. In the channel, the middle line has three square dots to adjust. By dragging and dropping, you can change the location of the channel. The first and the third dots modify the number of candlesticks for the channel.
Properties of the StdDev Channel in MT4
In MT5 and MT4, you can open the properties of the StdDev channel. Right-click on the channel on your chart, and select the first option, the “Properties of the StdDev Channel.”
The Properties of the StdDev Channel’s window has three tabs, Common, Parameters, and Visualization.
In the Common tab, you have the following options:
- Name: to name of your channel for later references;
- Description: to describe more your channel;
- Style: to select the thickness of the lines and color;
- Draw object as background: drawing the channel as the background of the price line or candlesticks; and
- Disable selection: if checked, you can not select and delete it. If you want to delete it, right-click on the chart and choose Object List. And, find the channel, check, and delete it.
The Parameters tab has the following options:
- First Date: represents the timeframe (candlestick) of the channel’s beginning;
- Second Date: represents the timeframe (candlestick) of the channel’s end;
- Ray Right: if checked, the channel will continue to the right without having any impact on the calculation;
- Ray Left: if ticked, the channel will continue to the left without affecting the channel’s calculation;
- Deviation: to select the number of standard deviations; and
- Fill: if checked, it will be colored.
Finally, the visualization tab has timeframes that you want to see your channel.

